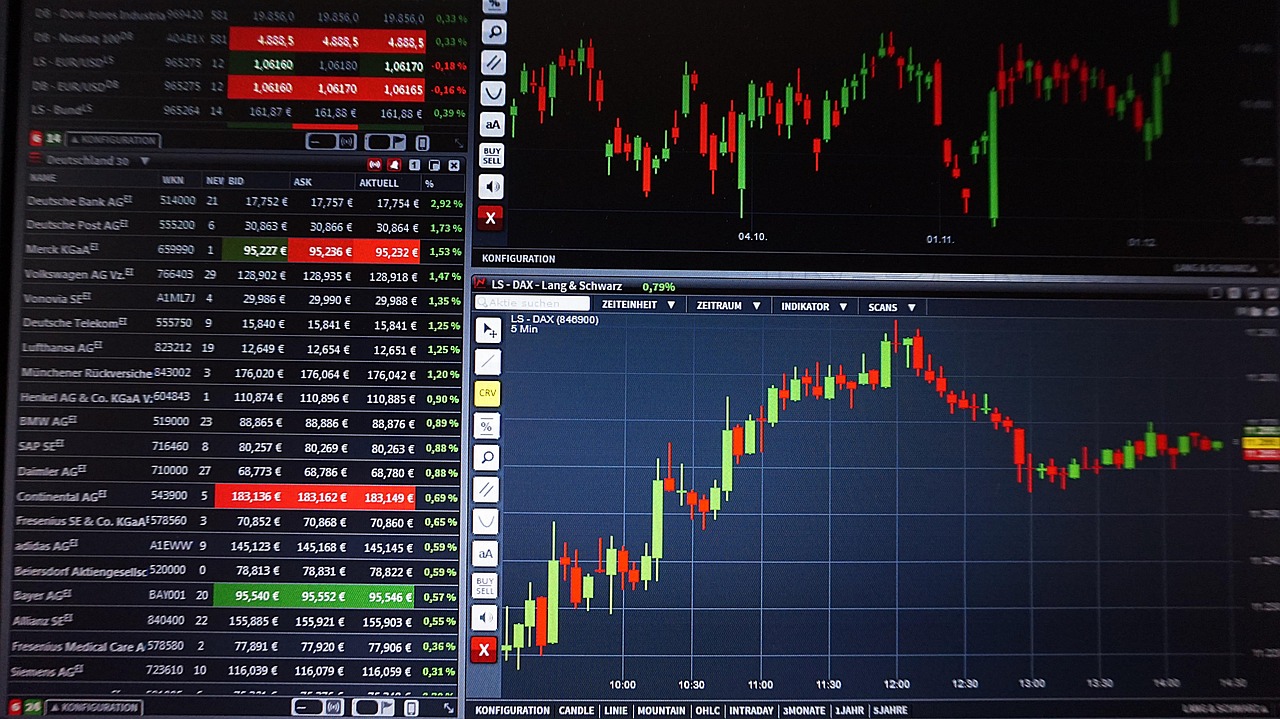
Candlestick patterns are visual representations in the form of charts that play a crucial role in trading strategies. These patterns are easy to understand due to their extremely simple structure. To formulate a trading strategy using candlestick patterns, it is essential to have a firm grasp of the underlying concepts. For instance: exactly what candlestick patterns are, how they are formed, their various types and how they function.
Through this blog, which provides comprehensive information on candlestick patterns; you can gain a detailed understanding of all the aforementioned concepts.
What Are Candlestick?
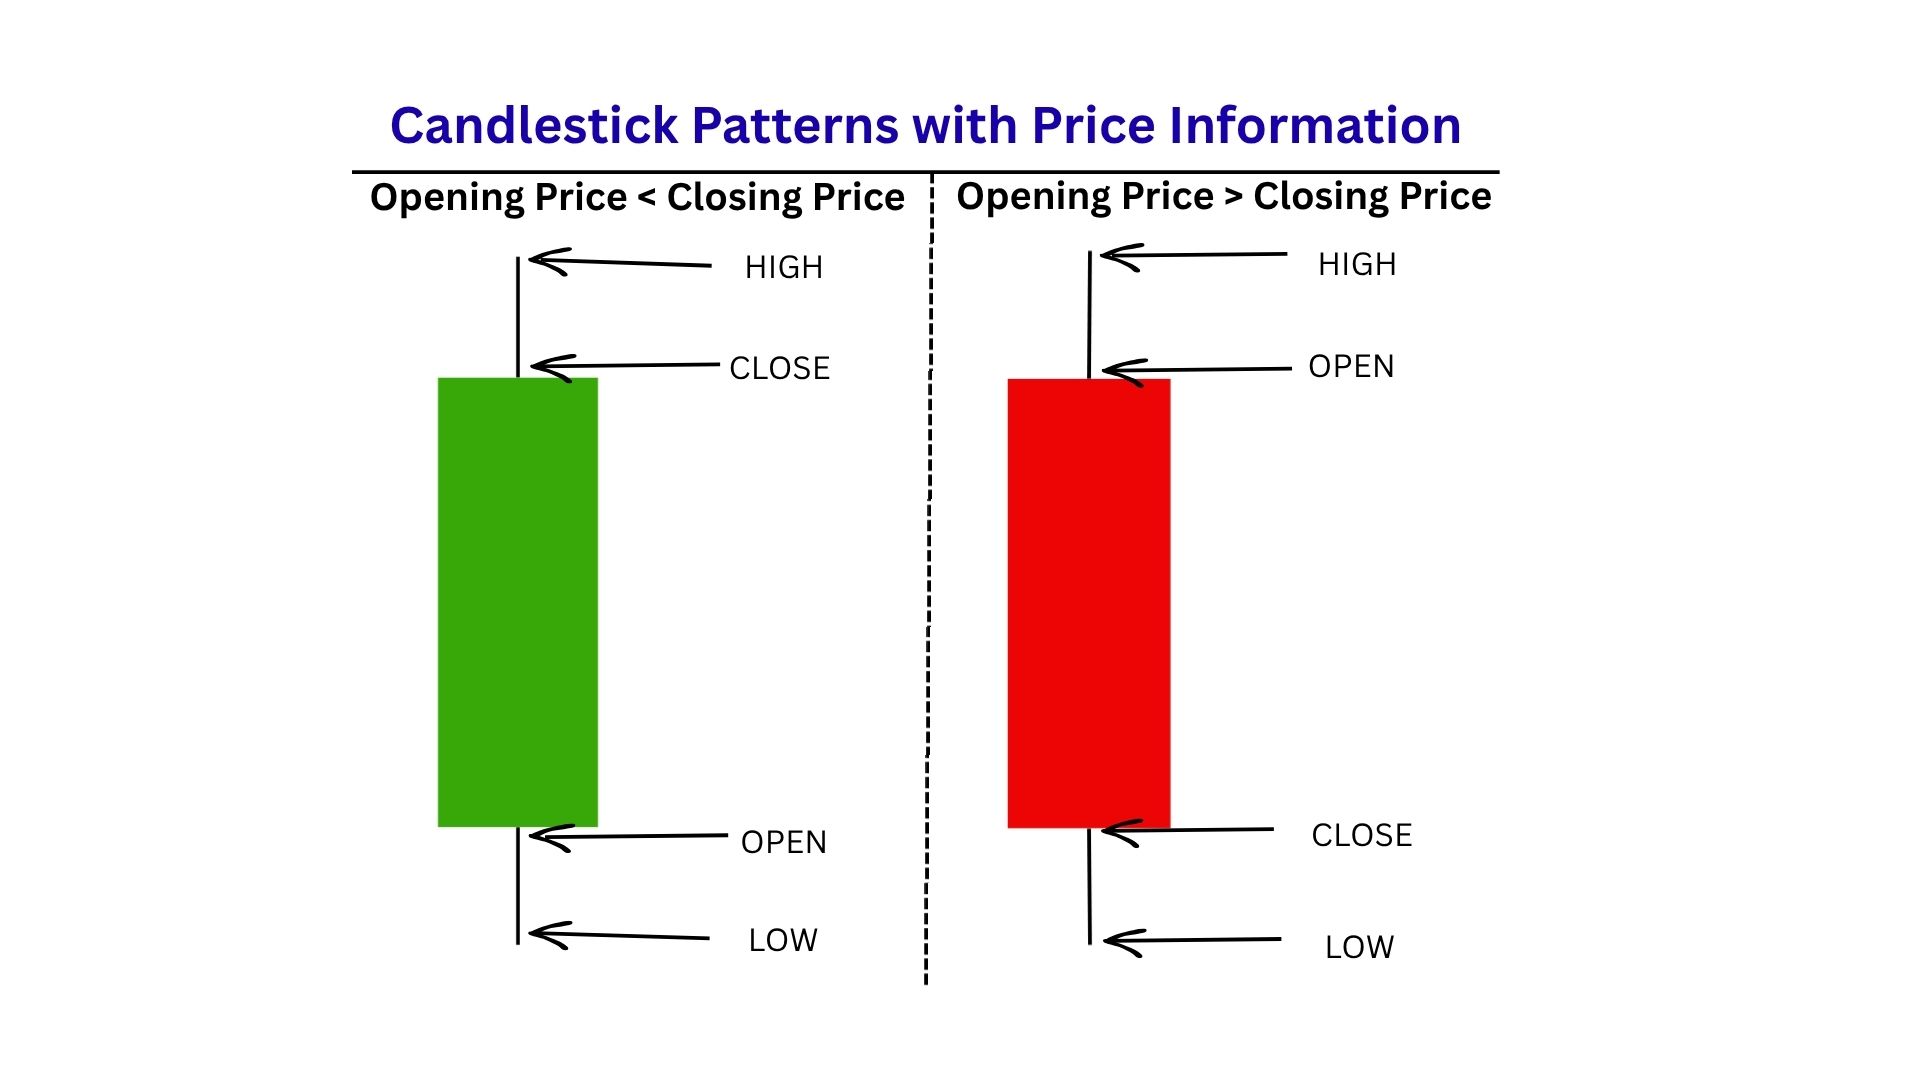
In trading, ‘candlesticks’ are used to visually represent price movements; specifically the ‘Open’ (starting), ‘High’ (highest), ‘Low’ (lowest) and ‘Close’ (closing) prices (OHLC)- of tradable instruments such as securities, derivatives, currencies, etc. Visually, candlesticks bear a striking resemblance to actual candles; it is for this very reason that they acquired this name.
In the image below, you can observe the OHLC prices as depicted by the structure of a candlestick. These prices reflect three specific states pertaining to the market or a particular financial instrument.
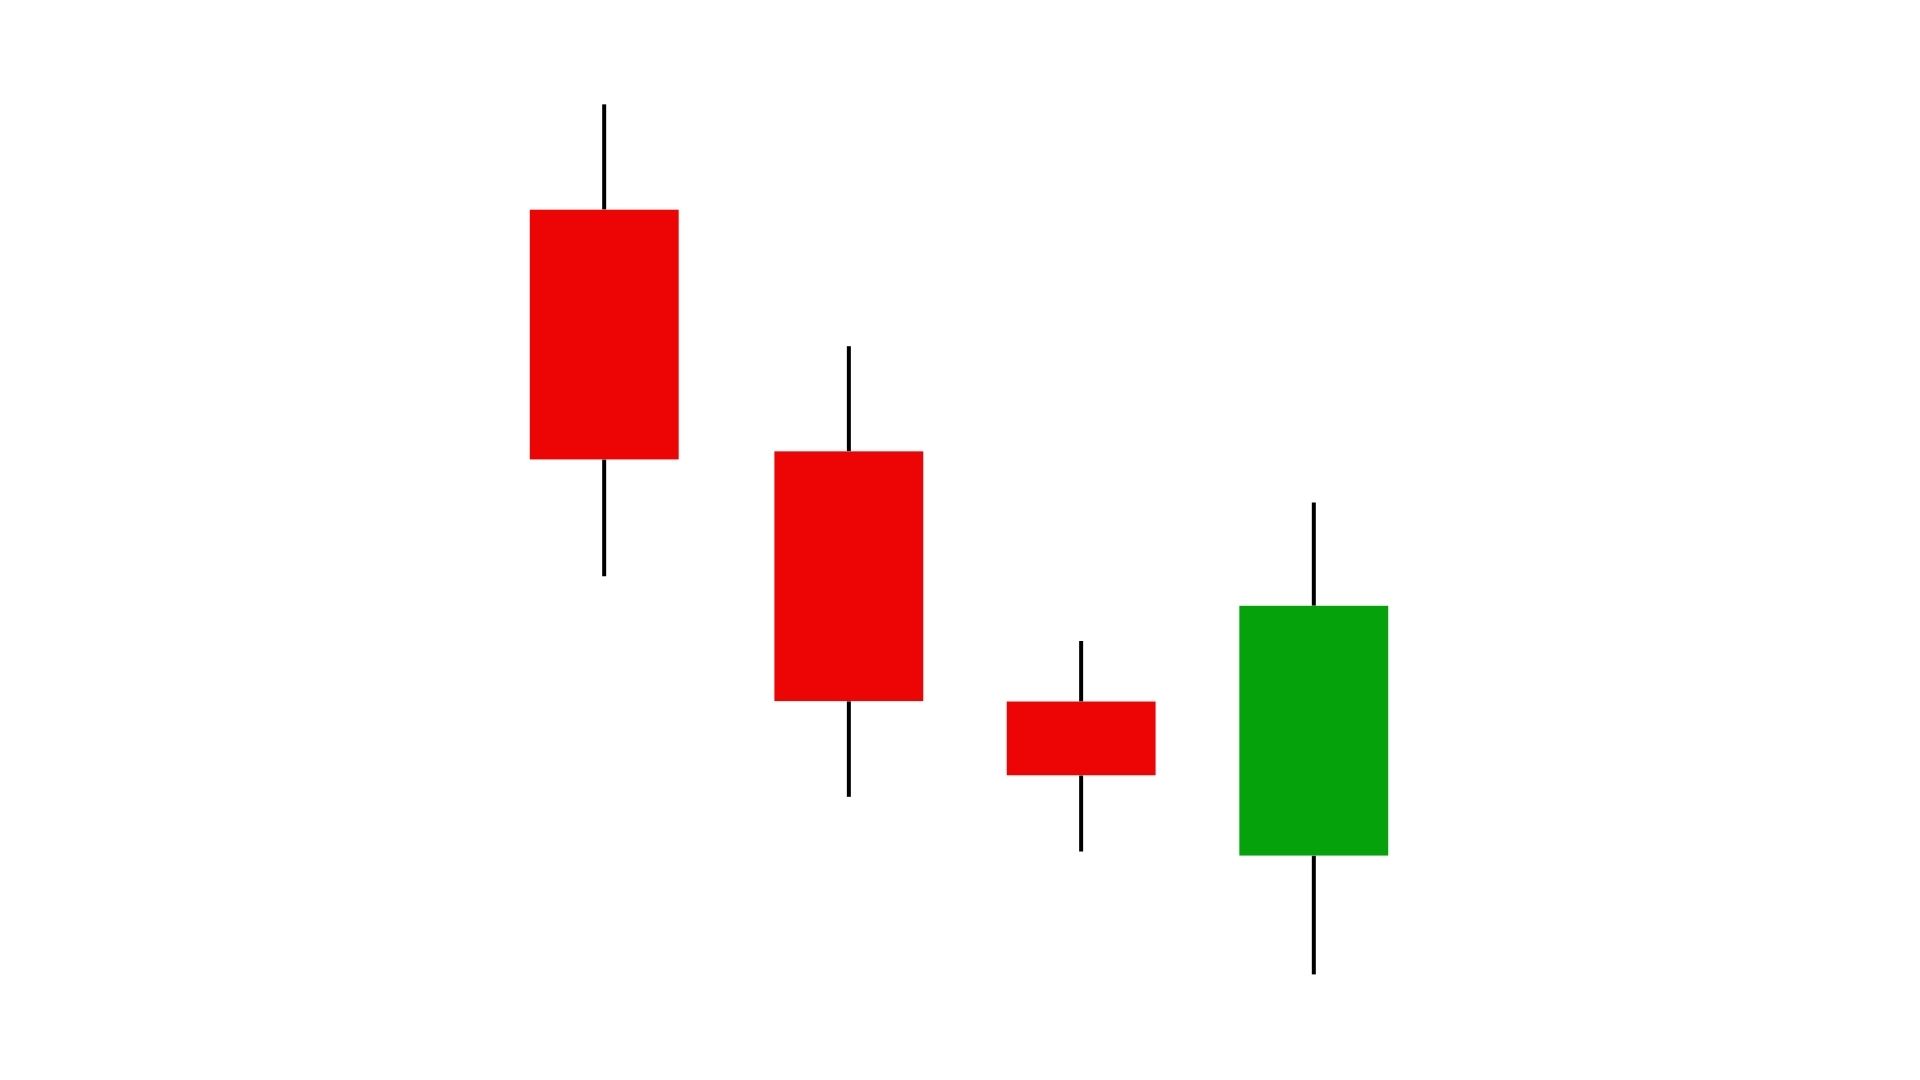
‘Candlesticks’ which indicate the direction of the market or a specific financial instrument, are of two types.
These two types are as follows:
- Green Candlesticks: These indicate an ‘Uptrend’ (rising direction) in the market.
- Red Candlesticks: These indicate a ‘Downtrend’ (falling direction) in the market.
To represent various price levels, candlesticks differ in their shape, structure, and even color. Since prices are constantly fluctuating, the shape and structure of the candlesticks also change accordingly.
These various shapes and structures can prove to be highly effective in forecasting the future direction of the market, as they can provide signals indicating the onset of a new trend or the possibility of a trend reversal.
What Are Candlestick Patterns?
Candlestick charts are a technical tool that consolidates data from multiple time frames into a single price bar. This makes them more informative than traditional Open, High, Low, and Close (OHLC) bars or simple line charts that merely connect closing prices.
Candlesticks form patterns that, once completed, can be used to predict the direction of future price movements. Appropriate color-coding adds greater depth to this colorful technical tool. Which traces its origins back to 18th-century Japanese rice traders.
Traditionally, candlesticks are best utilized on a daily basis, allowing each candle to capture a full day’s worth of news, data and price fluctuations. This suggests that candlesticks are particularly well-suited for long-term investors or swing traders.
Most importantly, every candlestick tells a story. When observing a candlestick, it is best viewed as a representation of the ongoing struggle between buyers and sellers.
Typically green candle indicates that buyers have prevailed, while a red candle signifies that sellers hold the dominance. However, the battle between buyers and sellers is a continuous process, unfolding throughout the market session; from the opening bell to the close. It is precisely these characteristics that make candlesticks such a highly effective charting tool.
Note:
- Candlestick patterns means technical trading tools, that have been used for centuries to predict price direction.
- There are many different candlestick patterns, featuring names that are intuitive and descriptive; most of them also have a corresponding counterpart pattern on the opposite side. For example, the counterpart to the ‘Abandoned Baby Top’ pattern is the ‘Abandoned Baby Bottom’; similarly, the bullish counterpart to ‘Tweezer Bottoms’ is ‘Tweezer Tops’.
- Traders utilize additional technical indicators alongside candlestick patterns to enhance the precision of their trading strategies (e.g., entry and exit points).
- Candlesticks are based on current and historical price movements and do not serve as predictors of the future.
Types of Candlestick Patterns
1. Bullish Patterns
Bullish Engulfing Pattern
This pattern consists of two candlesticks. The first is a small, bearish candle, followed by a large, bullish candle. As the name suggests, the larger candle completely engulfs the body of the preceding candle. Specifically, it opens below the lowest point of the small candle’s body; however, the bulls take control and drive the price up to close above the highest point of the preceding candle’s body. This signifies a transition from a bearish to a bullish sentiment, indicating strong buying pressure and potentially signals a reversal.
Bullish Harami Pattern
The Bullish Harami is another bullish candlestick pattern. It is a two-candlestick reversal pattern. In this pattern, a small bullish candlestick follows a large bearish candlestick, with the body of the smaller candle being completely contained within the body of the preceding larger candle. This formation indicates that selling pressure is subsiding and that buyers are regaining control on the following day. This is confirmed when a strong bullish candlestick appears after the Harami pattern.
Bullish Harami Cross
This is a variation of the Bullish Harami pattern, in which the second candlestick is a Doji; indicating a minimal, or virtually non-existent, difference between the open and close prices.
Unlike the Bullish Engulfing pattern, which signifies the dominance of the bulls, the Doji pattern suggests a state of indecision or stalemate in the market. This often implies that selling pressure has subsided and that the bulls are poised to take control of the market for a period of time.
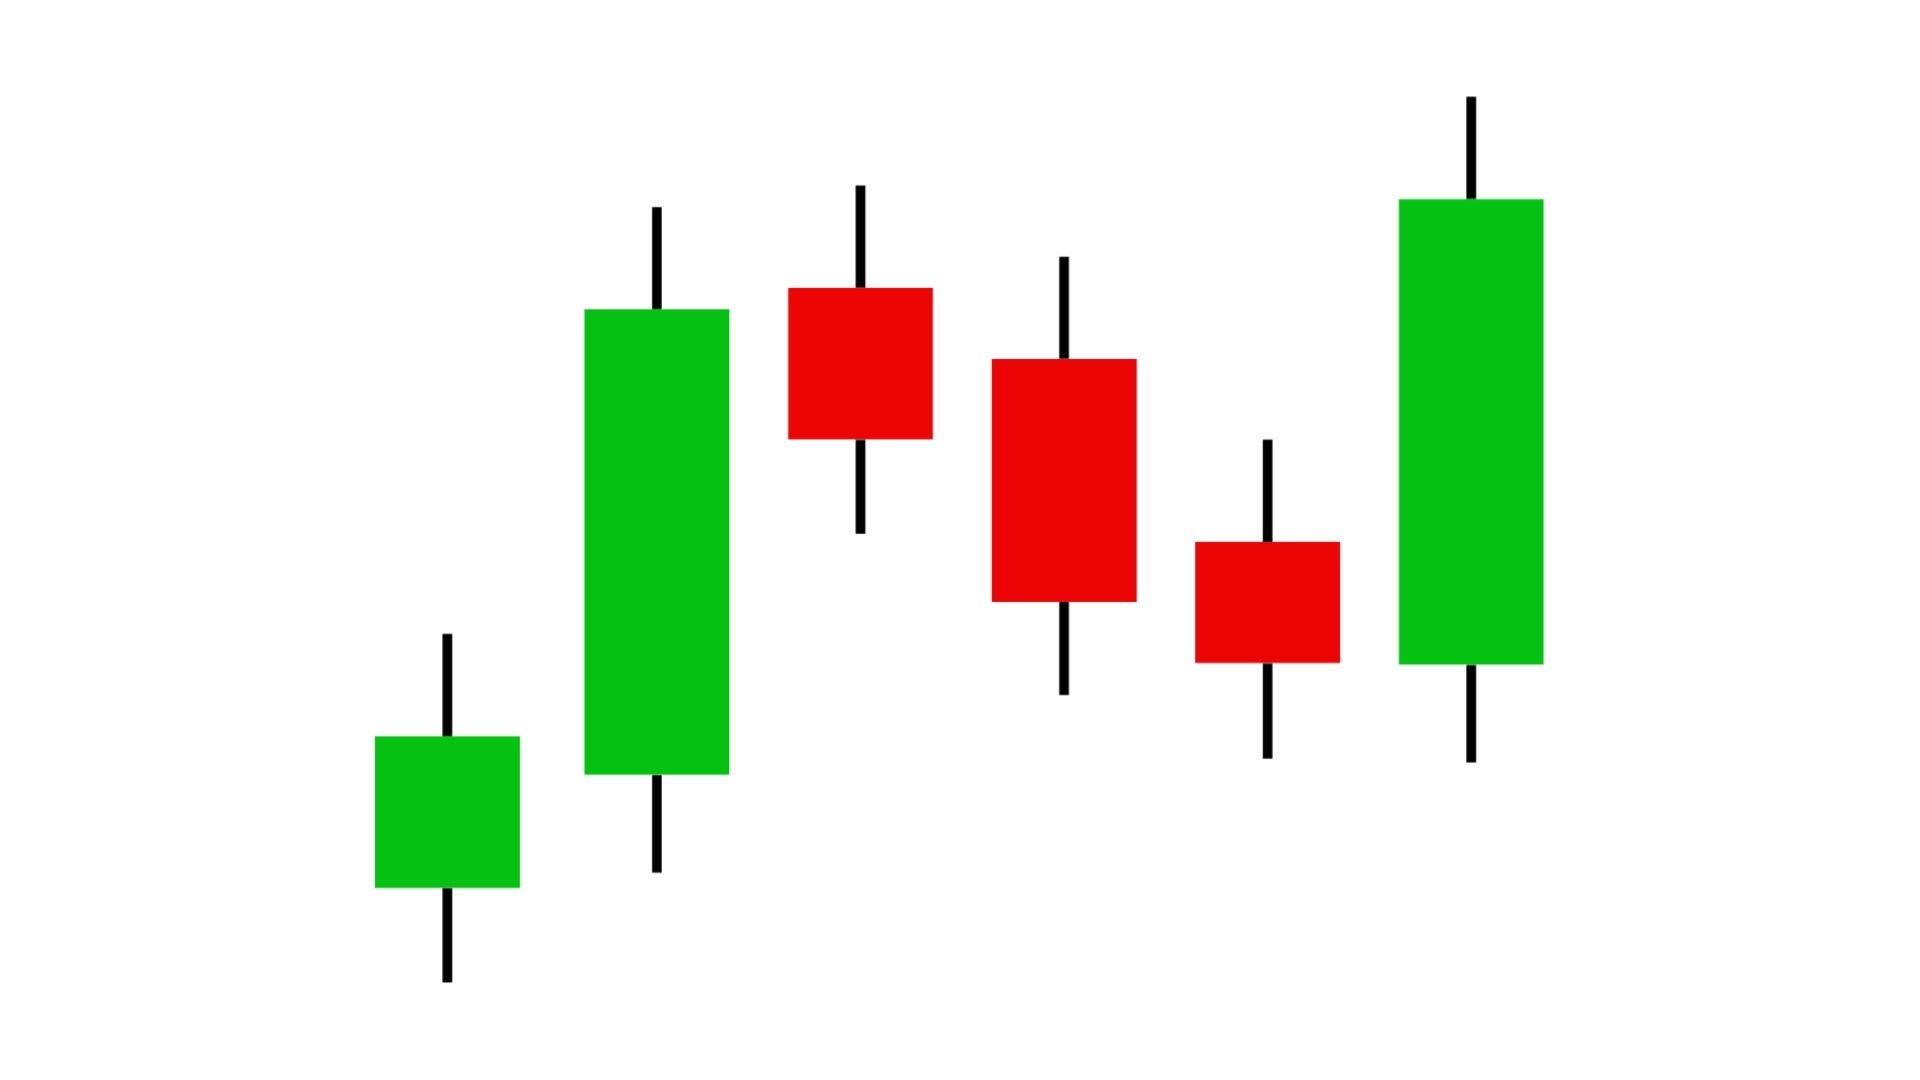
Rising Three Methods
This bullish continuation pattern signals a period of temporary consolidation before the prevailing bullish trend resumes. Its components include a single strong bullish candlestick; followed by three or more smaller bearish candlesticks that remain confined within the range of the initial candle.
Finally, another strong bullish candlestick closes above the closing price of the most recent bullish candle.
The small bearish candles indicate a brief period of profit-taking or a pause in buying activity in the absence of significant selling pressure. The final bullish candle confirms that buyers remain in control and that the price is likely to continue its upward trajectory.
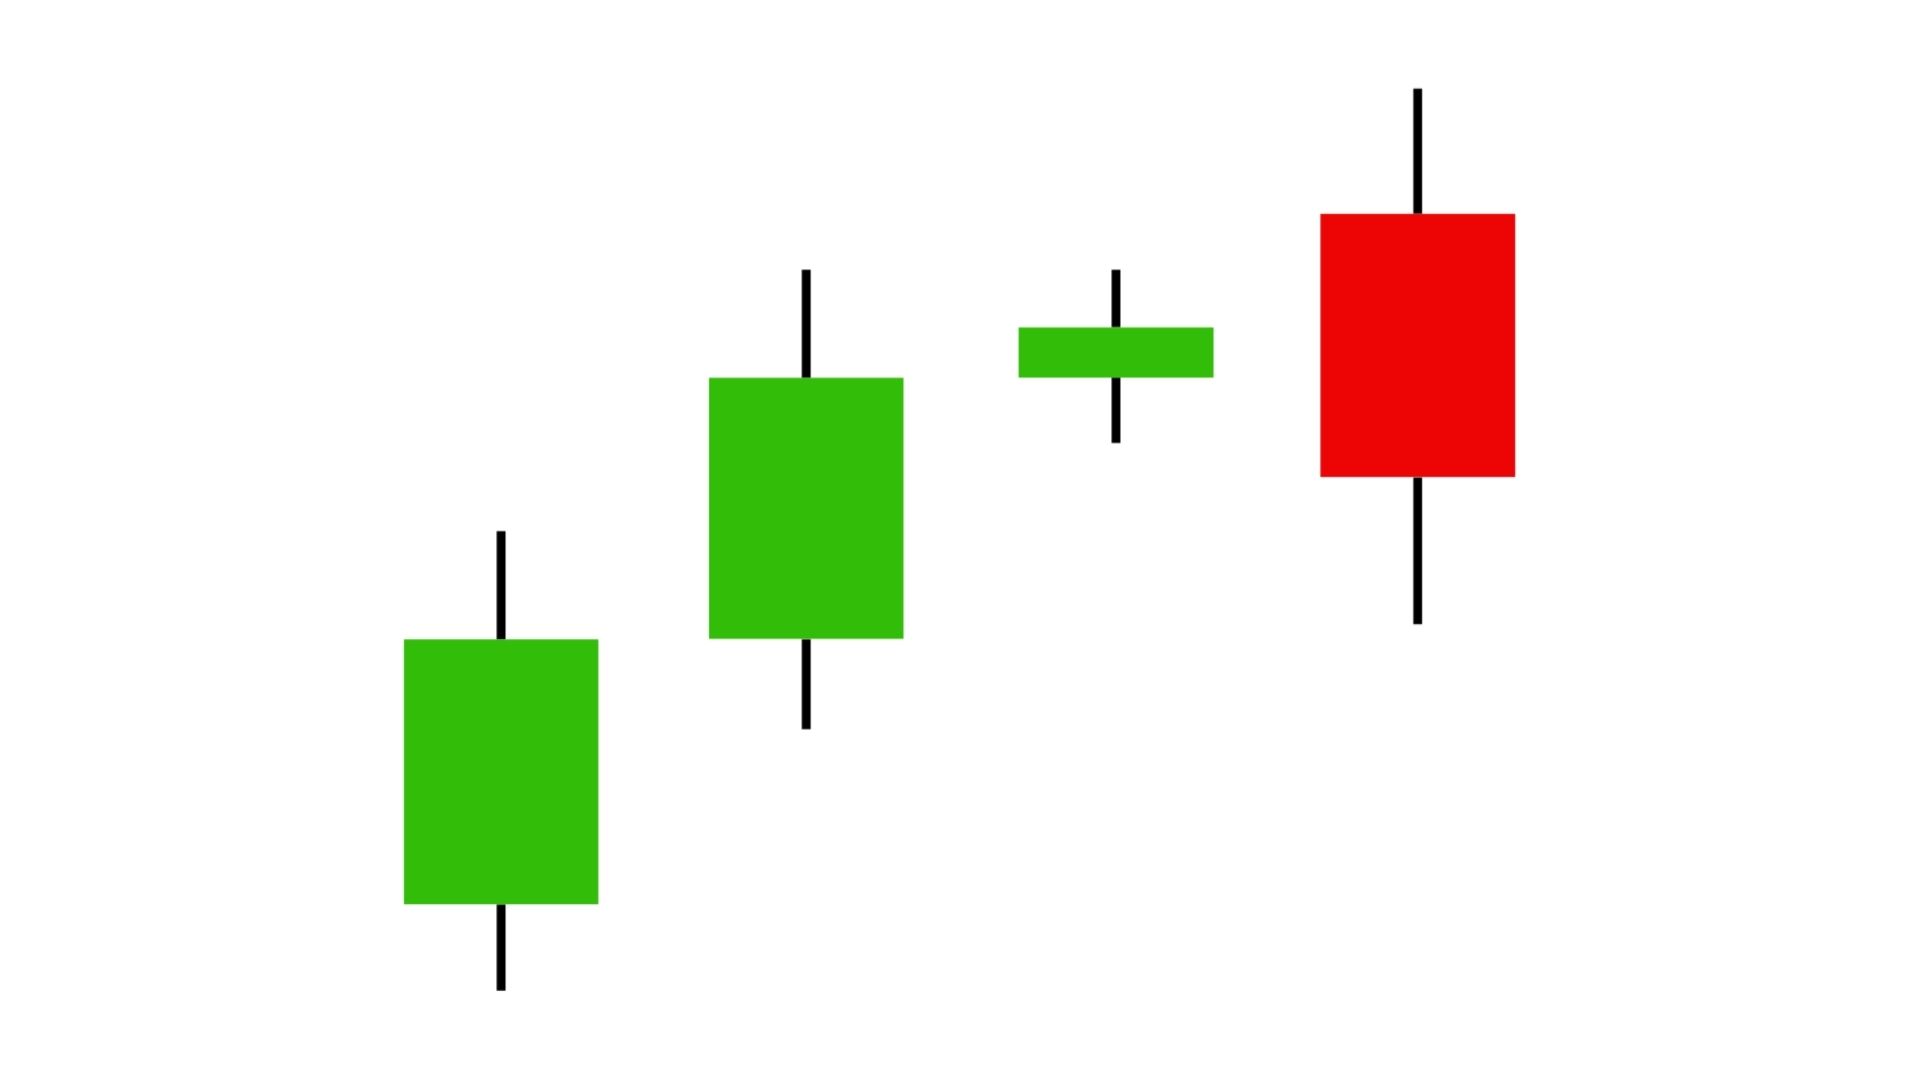
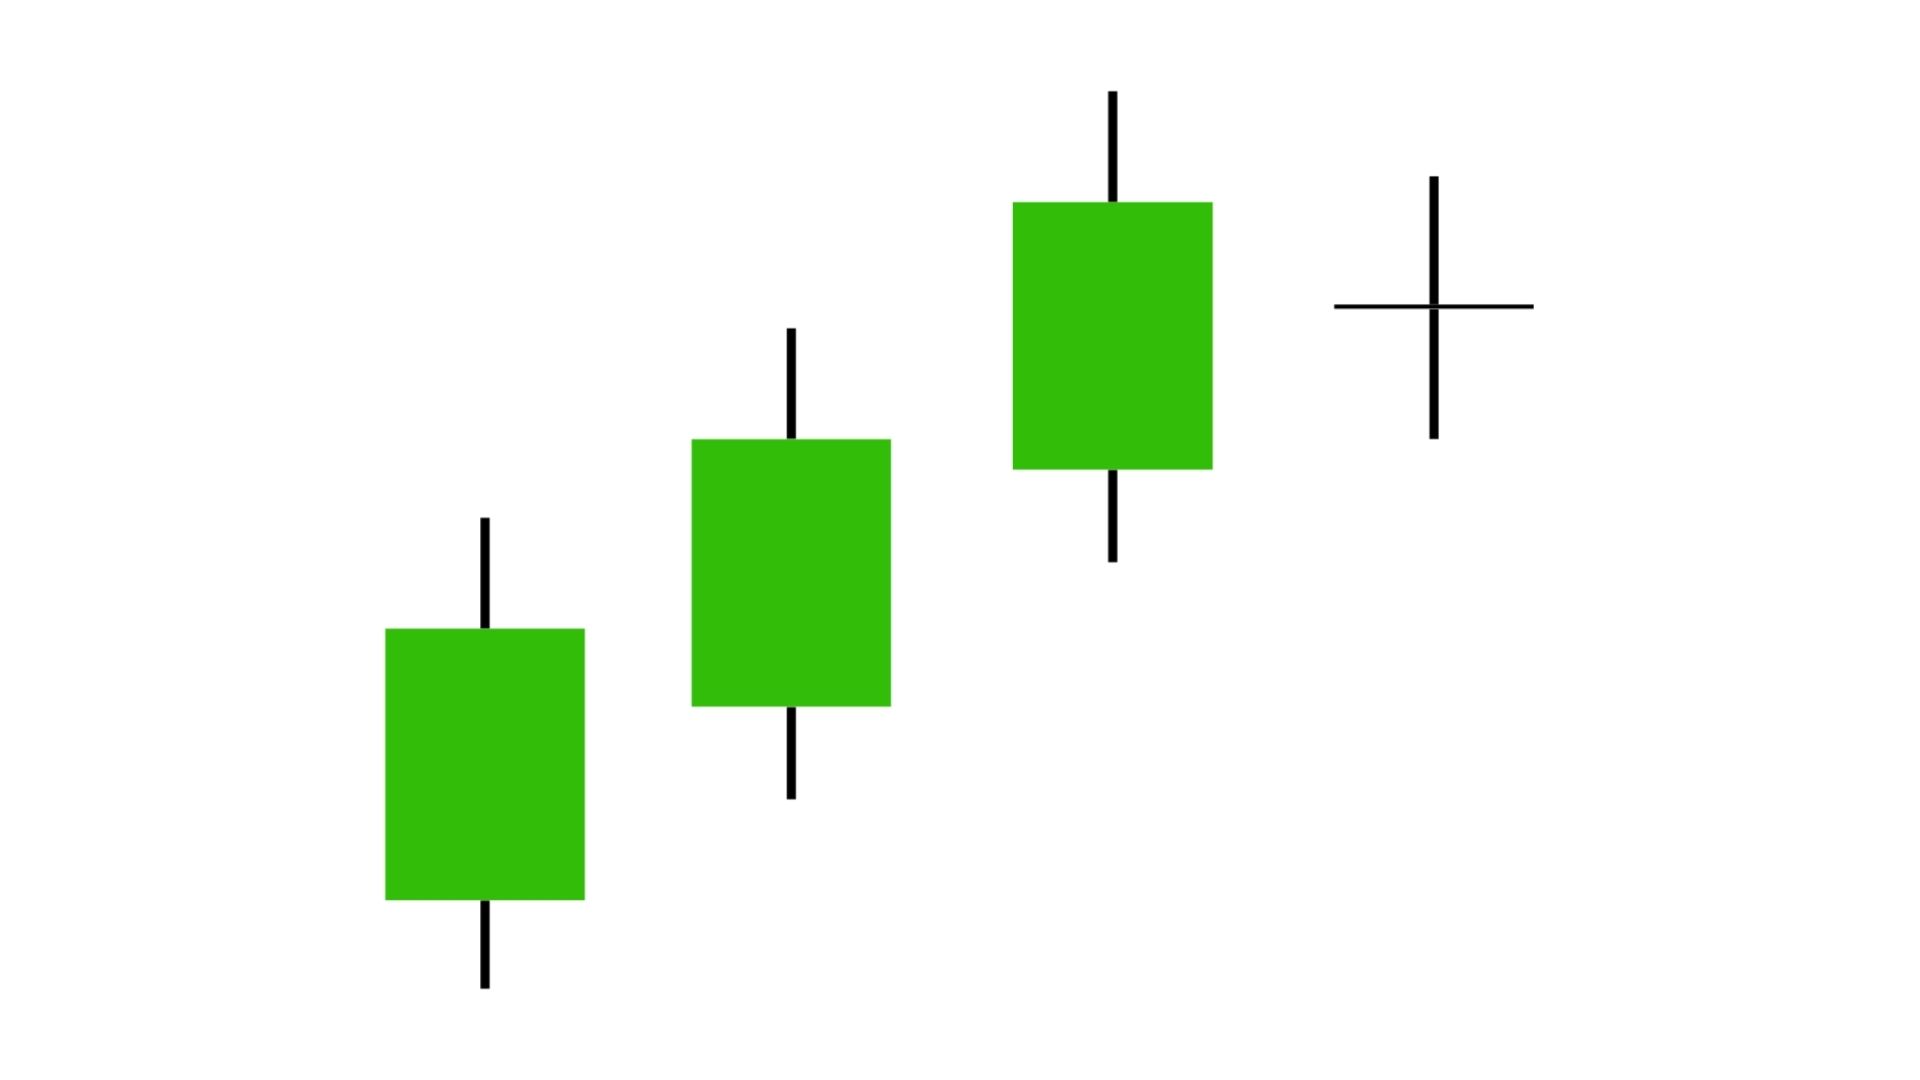
Morning Star
The Morning Star is a three-candlestick pattern that appears at the bottom of a downtrend. The first candle in this pattern is a long bearish candle, while the second is a small-bodied candle that, much like the Bullish Harami Cross, indicates market indecision. Finally, there is a strong bullish candle that confirms the market reversal. This pattern signals that, by the third day of the pattern, buyers have gained control. This often marks the beginning of an uptrend.
2. Bearish Patterns
Bearish Engulfing Pattern
This pattern consists of two candlesticks. The first candle is a small, somewhat bullish candle situated at the peak of an uptrend; it is followed by a large bearish candle that completely engulfs the body of the preceding candle. The Bearish Engulfing pattern signals a shift in sentiment from bullish to bearish, thereby indicating the likelihood of a price decline in the near future. It generally marks the end of an uptrend.
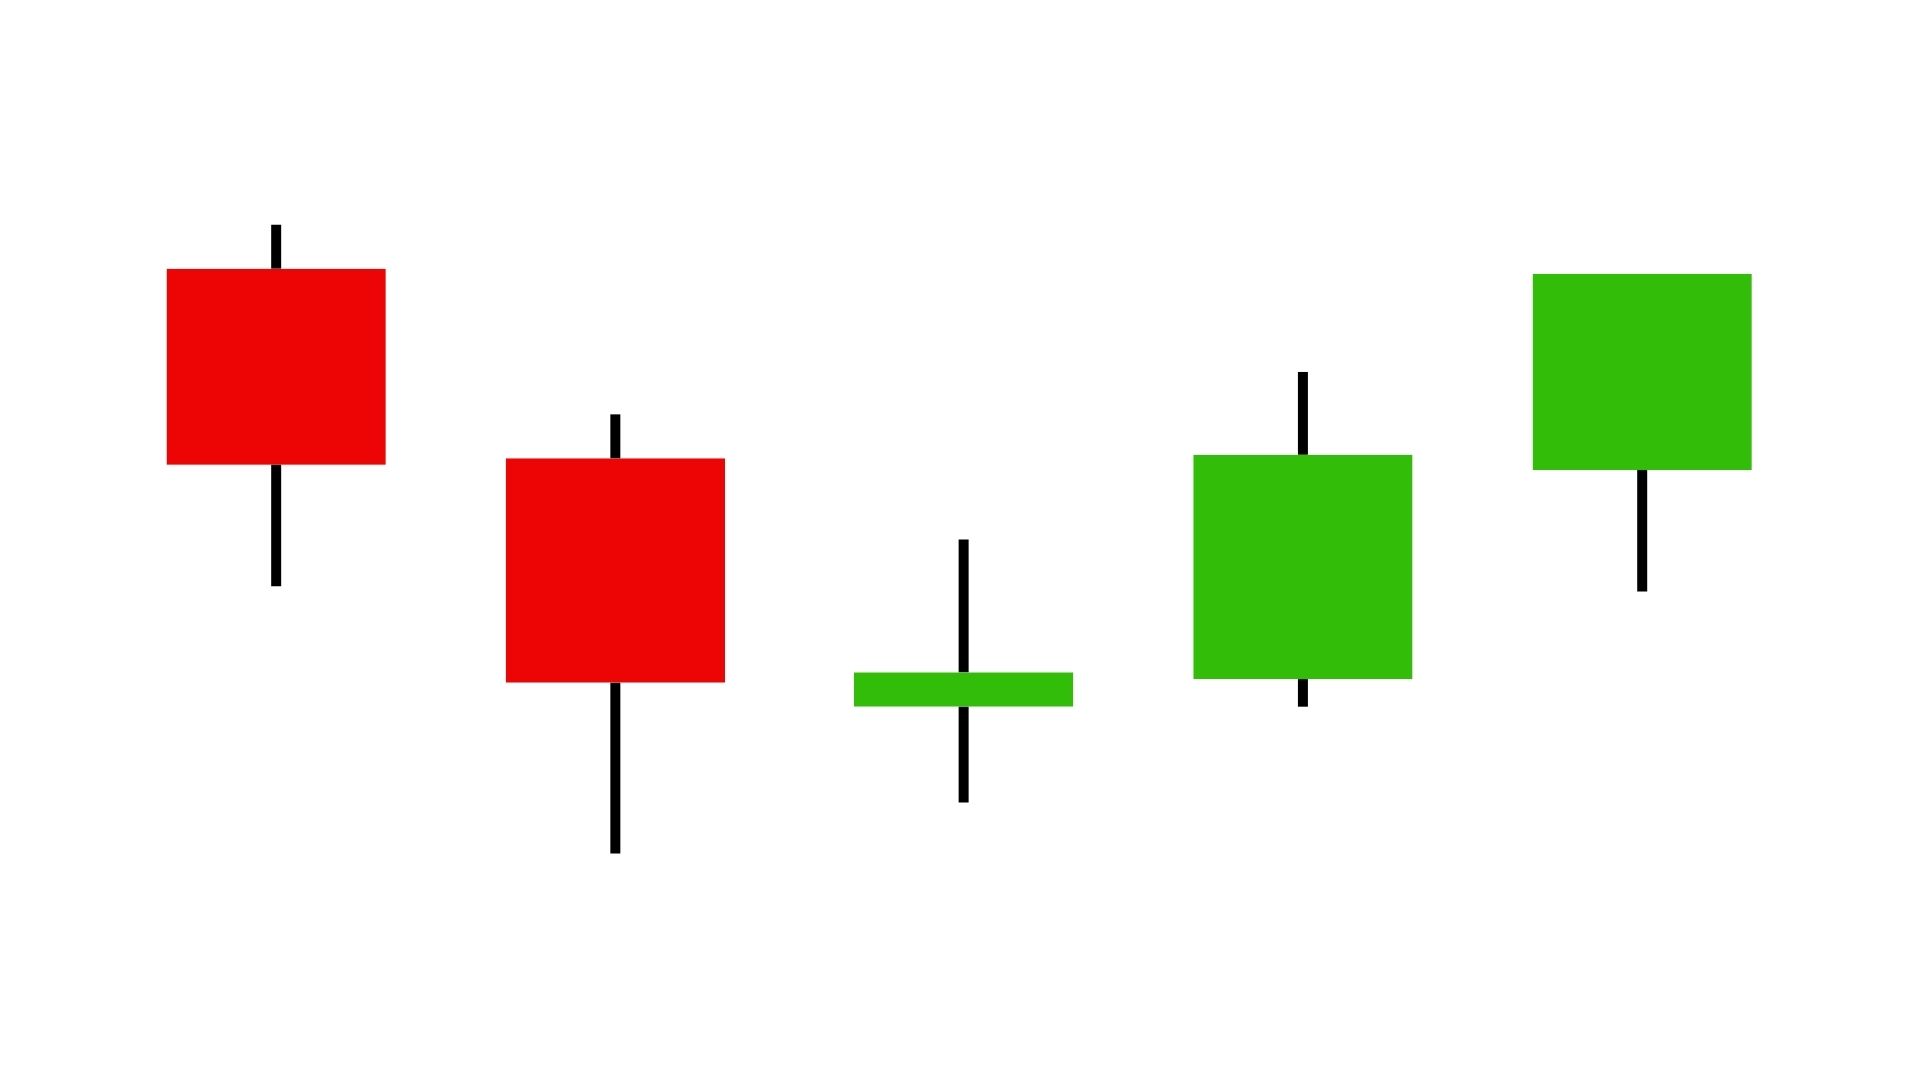
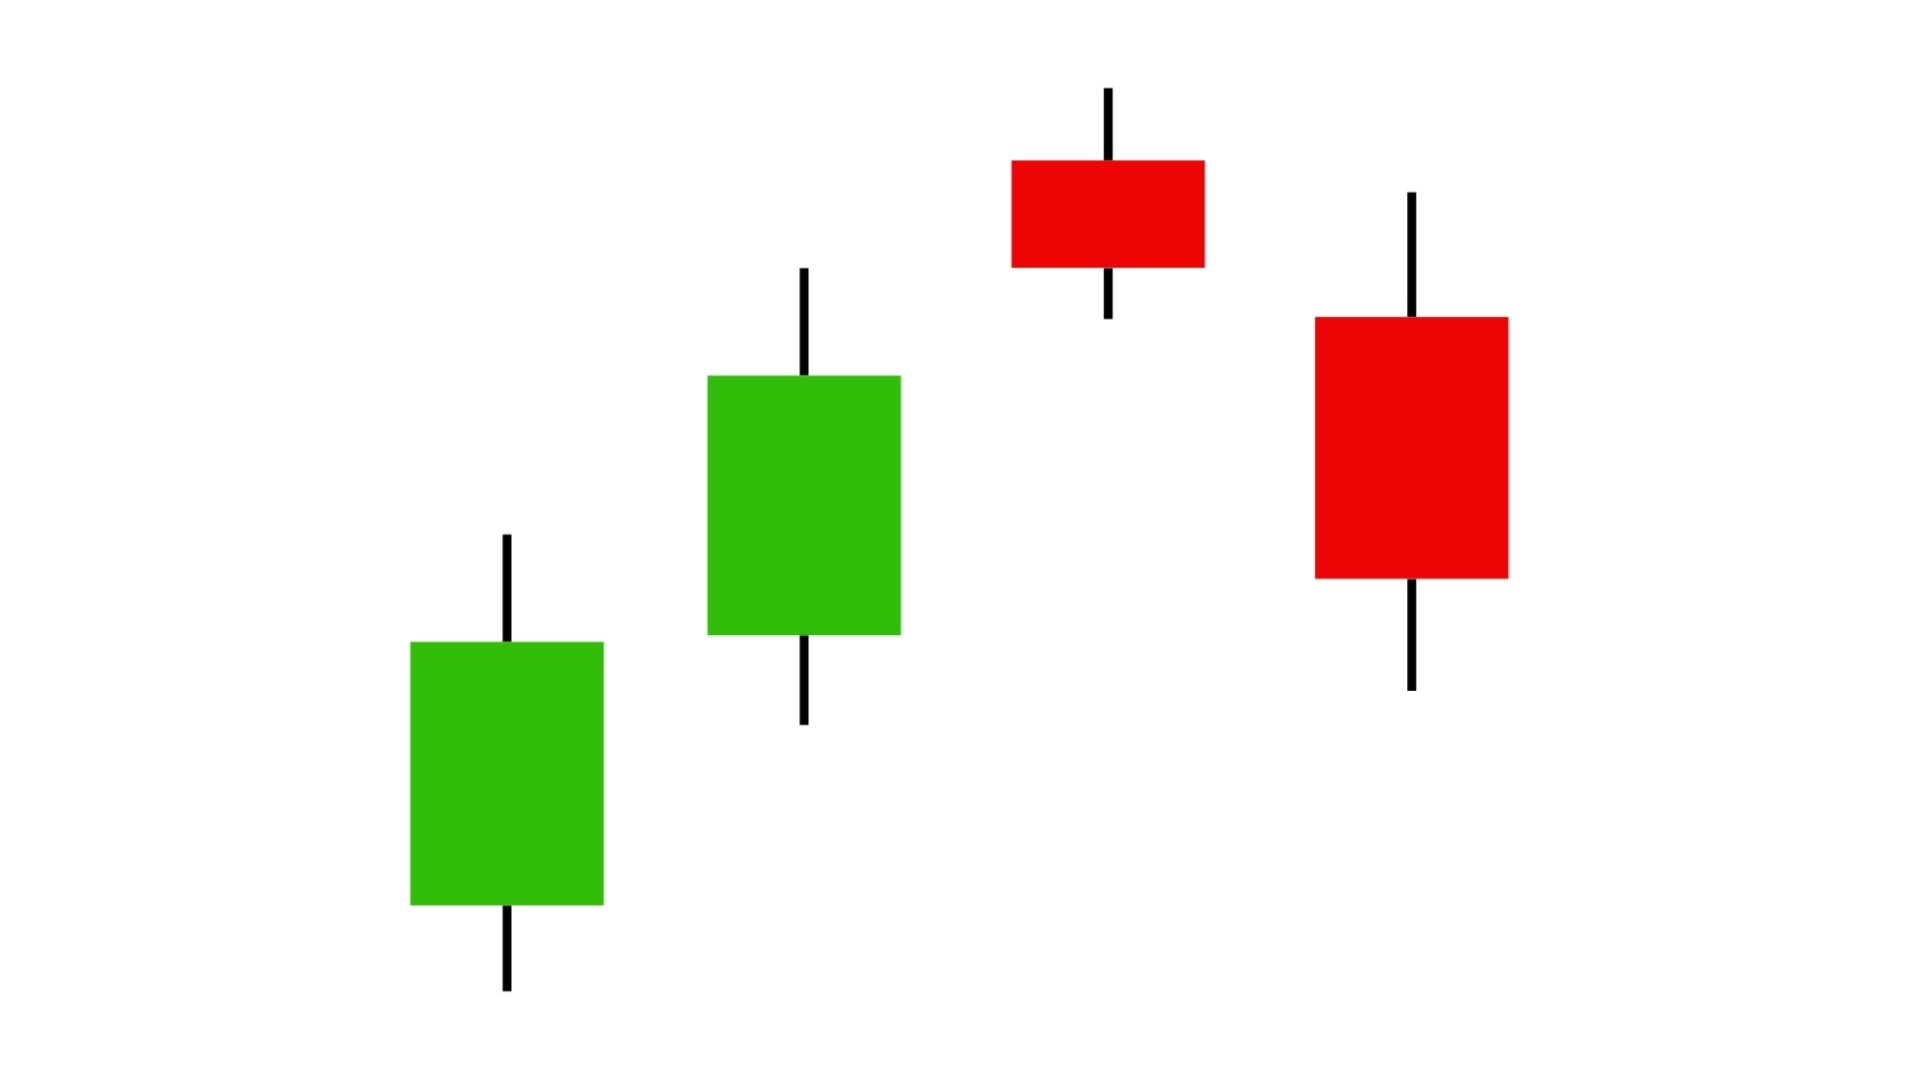
Evening Star
This is a three-candlestick pattern that appears at the peak of an uptrend. The first candle is a long bullish candle. This is followed by a small-sized candle, which signals market indecision. Finally, a strong bearish candle confirms the reversal. This pattern indicates that buying momentum is weakening and sellers are gaining control. This often marks the beginning of a downtrend.
Bearish Harami
This is a two-candlestick pattern that signals a potential reversal of an uptrend. It consists of a large bullish candlestick followed by a small bearish candlestick, which is completely contained within the body of the preceding candle. The Bearish Harami pattern indicates that buying momentum is weakening and sellers may be gaining control. A strong bearish candle would confirm the reversal.

Bearish Harami Cross
This is a variation of the Bearish Harami pattern, in which the second candle is a Doji, and its opening and closing prices are nearly identical. It signals intense uncertainty and a decline in bullish momentum. A solid bearish candle would indicate a reversal.
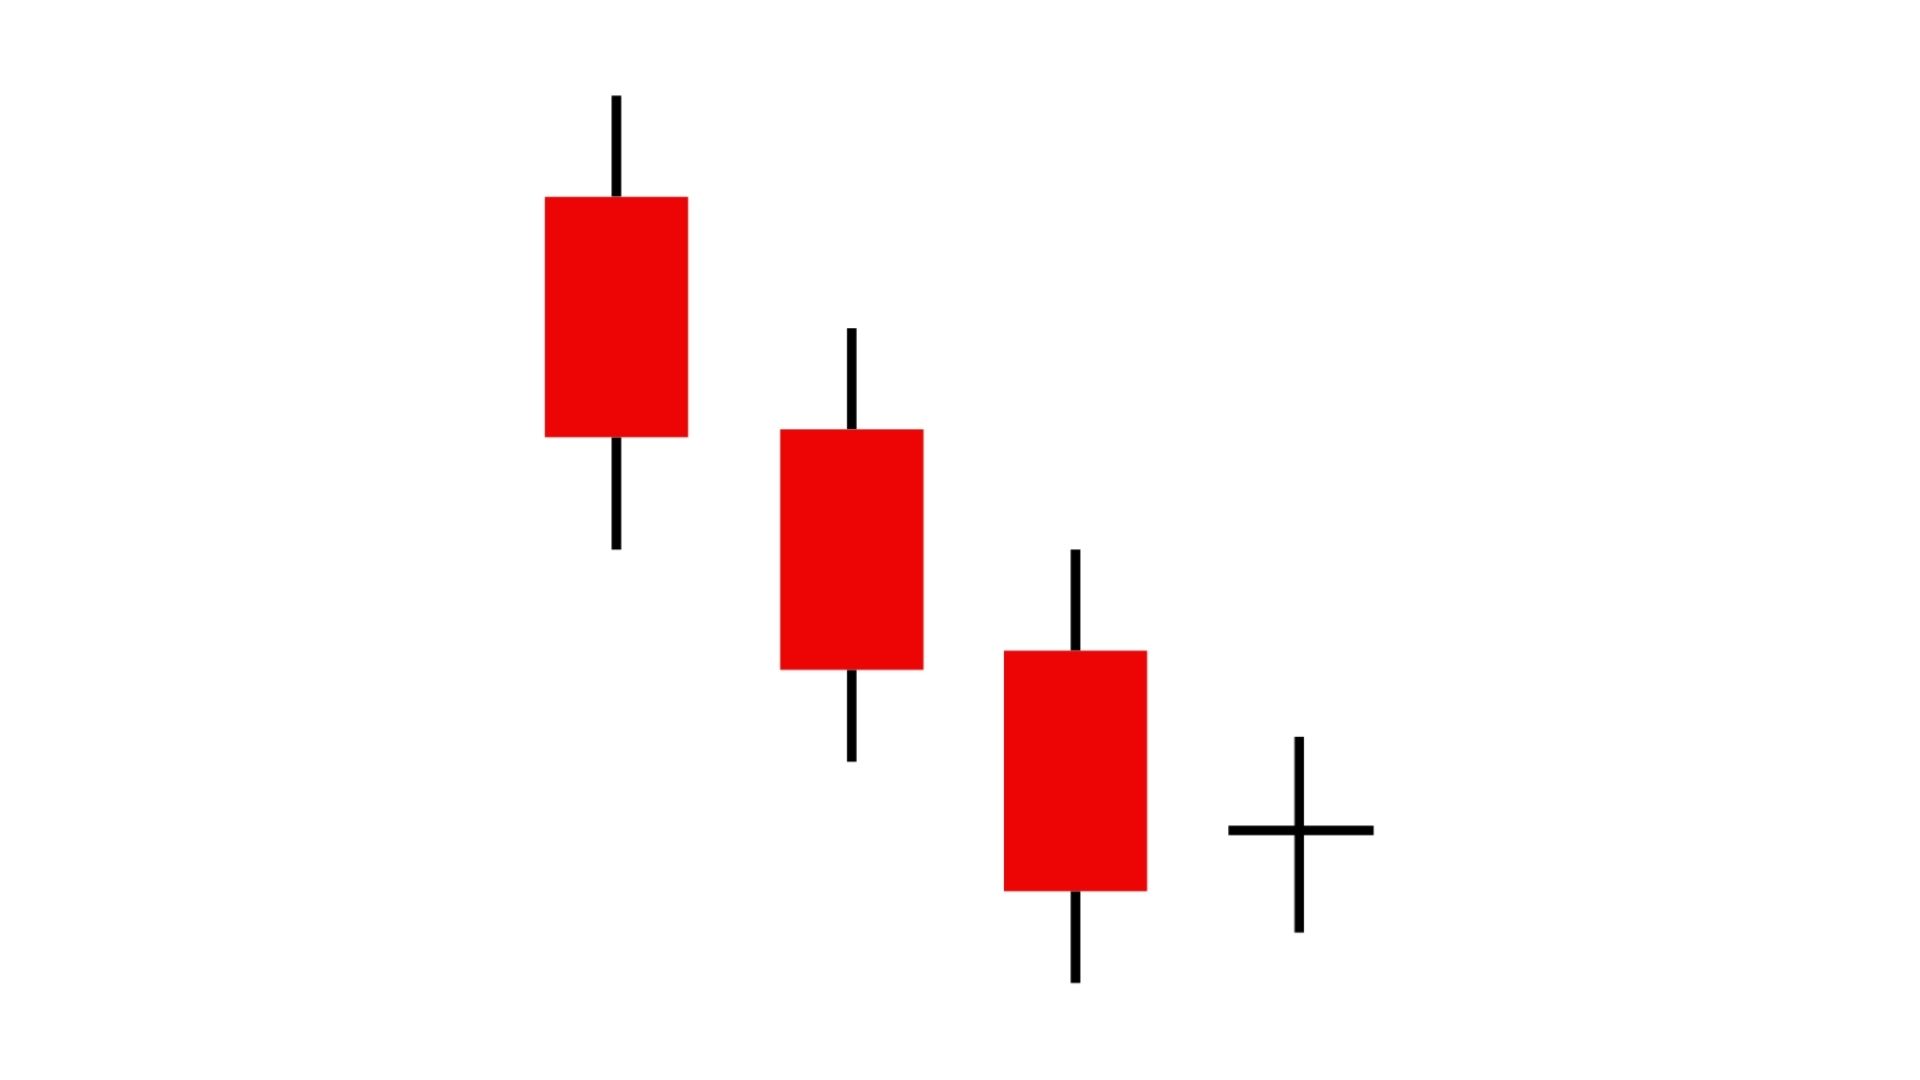
Falling Three Methods
The ‘Falling Three Methods’ is a bearish continuation pattern that signals a temporary consolidation before the downtrend resumes.
It consists of a strong bearish candlestick, followed by three or more small bullish candlesticks that remain within the range of the first candle, and finally, another strong bearish candlestick that closes below the close of the first candle. The small bullish candles indicate a brief pause in selling pressure; however, their inability to break to the upside suggests that the bears remain in control. The final bearish candlestick confirms the continuation of the downtrend.
How to Read a Candlestick Patterns
Much like a bar chart, a candlestick chart comprises four key price points: Open, High, Low, and Close. The High is represented by the upper tip of the upper shadow, or by the real body itself if no shadow is present. While the Low is indicated by the lower tip of the lower shadow, or by the real body in the absence of a lower shadow.
Ultimately, the relationship between the closing price and the opening price determines whether a candlestick is bullish or bearish. If the price closes above the opening price, the candlestick is bullish; conversely, if the price closes below the opening price, the candlestick is bearish. By utilizing colored candlesticks, traders can instantly identify whether a candlestick is bullish or bearish.
By analyzing these four price points across multiple candlesticks; traders can discern market sentiment and observe how the bulls and bears are performing relative to one another, thereby aiding in the prediction of potential price movements.
Candlestick Patterns vs Other Indicators
| Candlestick Patterns | Other Indicators |
| Based on price action | Based on calculations |
| Faster signals | Slightly lagging signals |
| Best for entry timing | Best for confirmation |
| Shows psychology | Shows momentum & trend strength |
Frequently Ask Questions
1. How reliable are candlestick patterns for predicting price movements?
Candlestick patterns can reveal a great deal about what is happening in the market; however, their effectiveness depends on market conditions and the chosen time frame. To mitigate the risk of false signals, they prove most effective when used in conjunction with other technical indicators.
2. Can candlestick patterns be used across all financial markets?
Yes, candlestick patterns can be applied across various financial markets, including stocks, forex, commodities and cryptocurrencies. The way they visually depict price movements makes them useful in diverse market environments. However, market volatility and liquidity can influence their accuracy.
3. What is the difference between bullish and bearish candlestick patterns?
A bullish candlestick pattern indicates that the closing price was higher than the opening price. In trading terminology, this signifies buying pressure and a potential upward trend. A bearish candlestick pattern indicates that the closing price was lower than the opening price. This is a sign of selling pressure and a potential downward trend.
4. How are candlestick patterns combined with other technical indicators?
To ensure the accuracy of candlestick patterns, traders often validate them against other technical indicators—such as Moving Averages, the Relative Strength Index (RSI) and volume analysis. This approach provides a more comprehensive overview of the market and helps filter out false signals.
5. Are there any free resources available to learn more about candlestick patterns?
Yes, there are plenty of free resources available online. Educational websites like ‘BabyPips’ offer detailed guides, tutorials and articles covering candlestick patterns and technical analysis concepts.
Conclusion
Learning candlestick patterns helps you read stock charts with greater confidence. By understanding bullish and bearish signals, you can improve your trading decisions. Start with the basic patterns, combine them with support and resistance, and always practice proper risk management. With practice, candlestick analysis becomes easier and more accurate.
Disclaimer
This article is for educational purposes only and not financial advice. I am not a SEBI-registered advisor. Please consult your financial advisor before investing.
If you have any questions, feel free to contact us.
Thank you for visiting our StockTrades Blog.
Mrunmay is a Data Analytics enthusiast with a background in Software Engineering and Machine Learning. He has completed professional training in SQL, Python, Data Analysis and ML and has worked on multiple data-driven projects. With a strong interest in stock market analysis and technical trading strategies, he focuses on simplifying complex market concepts into practical and easy-to-understand guides for traders.
Note: The information shared is for educational purposes only and not financial advice.