
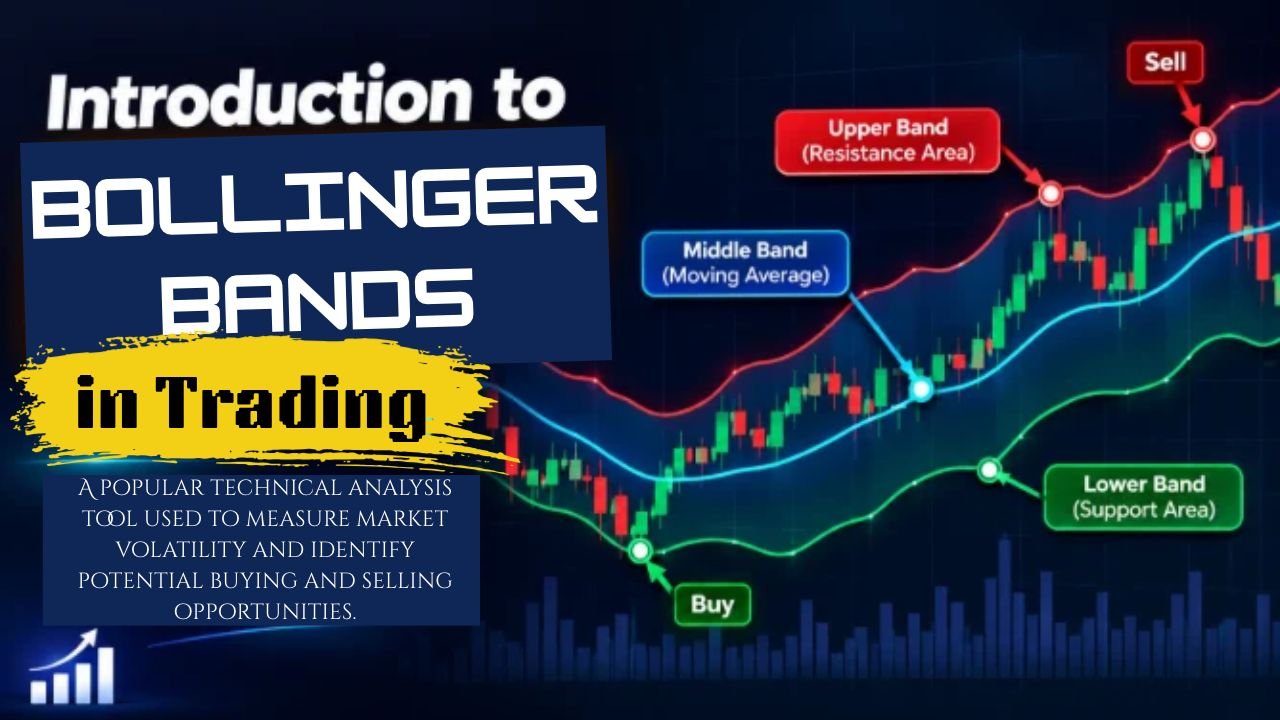
Markets don’t just move up or down in a straight line. Quite often, prices just drift sideways in a narrow range before making a sudden, sharp move. If you want to trade successfully, you need to understand these shifts in volatility. It helps you read price action clearly and keeps you from jumping into trades without real confirmation. This practical guide covers how to read volatility, spot reliable Bollinger Bands setups, and avoid trap signals. We will also discuss why you should never rely on just one indicator and how to pair it with other trading tools.
What Are Bollinger Bands?
John Bollinger designed these bands, to give traders a quick way to see if a price is relatively high or low. Think of them as dynamic boundaries that stretch and shrink like a rubber band based on market action. When the market goes crazy, the bands widen; when things calm down, they contract. The reason they are so heavily used in crypto, stocks and forex is simple, they adapt to the market automatically, saving you from constantly tweaking your charts.
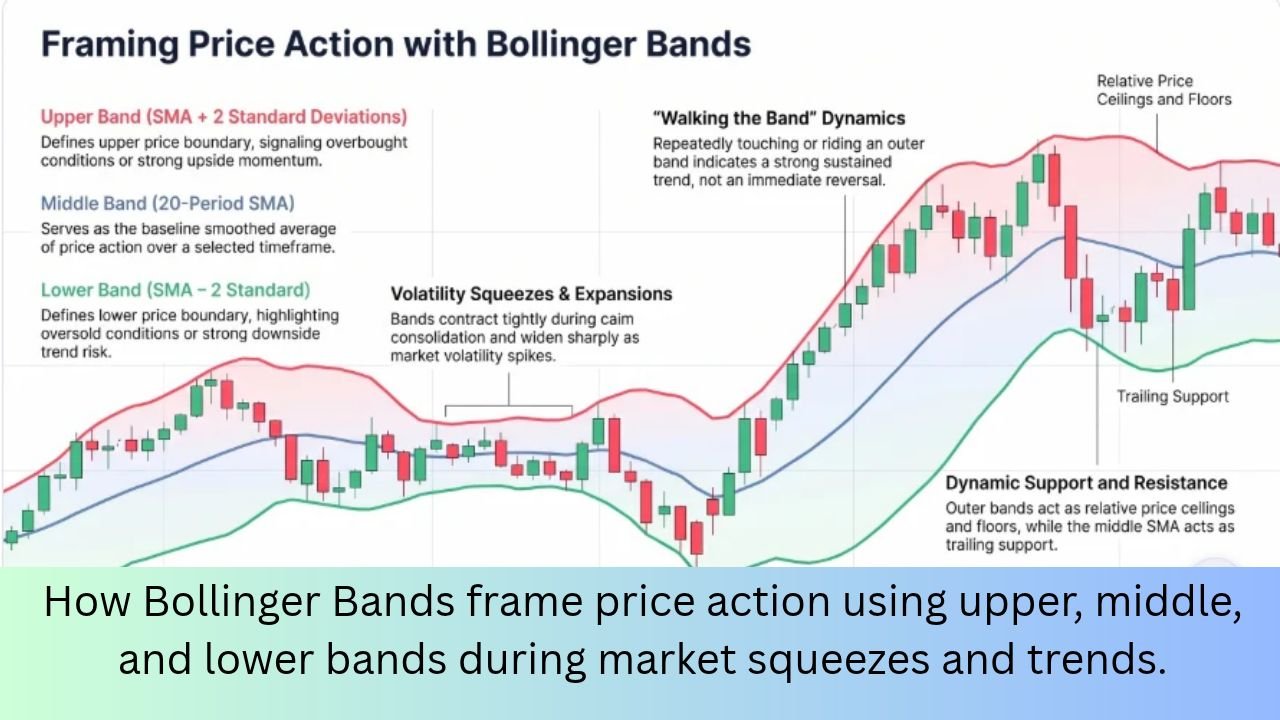
As you can see in the chart above, Bollinger Bands are made of three distinct lines. The middle line is a simple 20-period moving average. The upper and lower bands sit on either side, moving dynamically as market volatility changes. When trading hits a quiet phase, the bands contract tightly, this is what traders call a ‘volatility squeeze.’ Once the market wakes up, the bands widen sharply, often signaling the start of a strong trend where the price literally ‘walks’ along the outer band.
How Do Bollinger Bands Work?
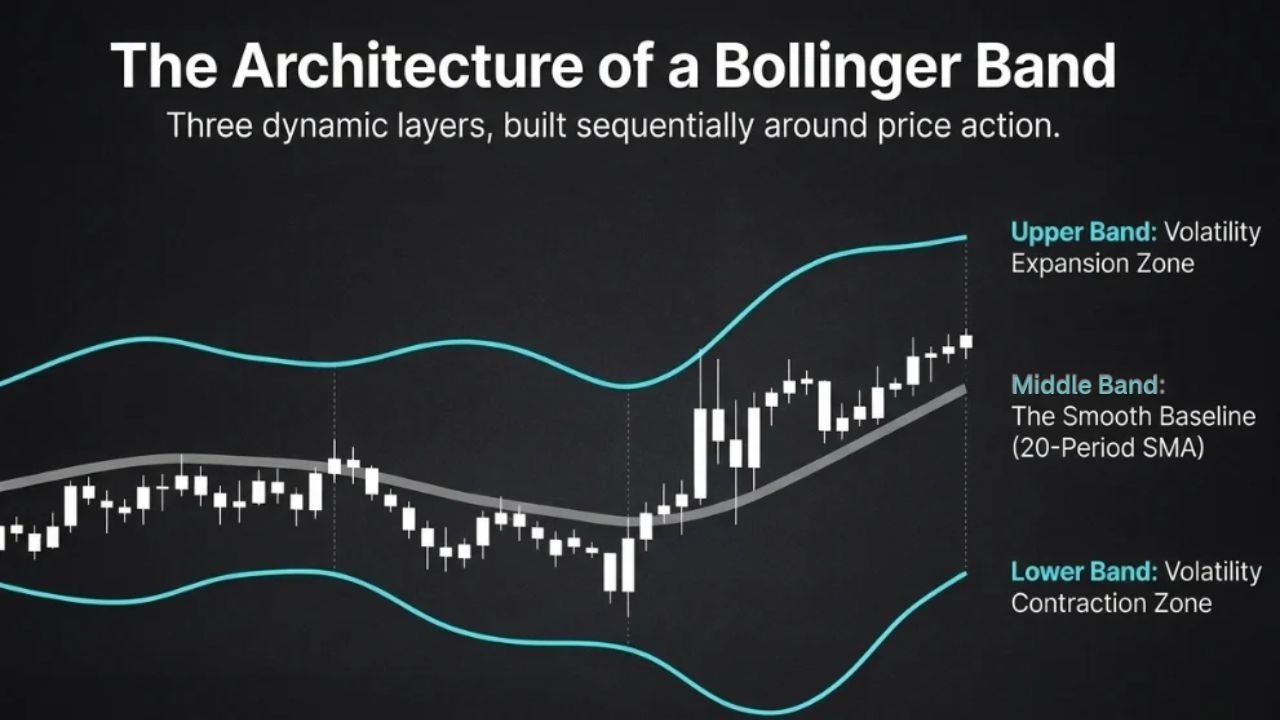
When you apply Bollinger Bands to your chart, you will immediately see three lines wrapping around the price action:
- The Middle Band: Think of this as the core baseline. It is a standard 20-period simple moving average (SMA) that shows the smoothed-out average price over that time.
- The Upper Band: This line runs right above the price. It is calculated by taking that middle SMA and adding two standard deviations to it.
- The Lower Band: This boundary runs below the price action. It is found by subtracting those same two standard deviations from the middle SMA.
By default, the indicator uses a (20, 2) setup. That means a 20-period lookback with bands set 2 standard deviations away. This default calculation creates a flexible channel that naturally contains roughly 95% of all historical price movements.
How It’s Calculated
Charting software calculates Bollinger Bands automatically, but understanding the basic formula helps explain how the bands respond to price volatility.
- SMA: Sum of closing prices divided by the number of periods.
- Standard Deviation (SD): A measure of how far prices move from their average.
- Upper Band: SMA + (2 × SD)
- Lower Band: SMA − (2 × SD)
Example:
Suppose a stock closes at 10, 12, 11, 13, and 14 over five days.
- SMA: (10 + 12 + 11 + 13 + 14) ÷ 5 = 12
- Standard Deviation: 1.41
- Upper Band: 12 + (2 × 1.41) = 14.82
- Lower Band: 12 − (2 × 1.41) = 9.18
Understanding Band Width & Volatility
Standard deviation is what makes Bollinger Bands so unique compared to basic price envelopes.
- High Volatility: When prices spike or drop violently, standard deviation goes up, causing the bands to expand wide apart.
- Low Volatility: When trading activity slows down and prices consolidate, standard deviation drops, forcing the bands into a tight squeeze.
Because of this dynamic design, the bands never become obsolete. They automatically adjust to sudden shifts in market speed, giving you a highly accurate picture of current volatility.
Squeeze and Expansion
- The Squeeze: When the bands move closely together, it indicates that price volatility has fallen to a relatively low level. A period of low volatility can sometimes be followed by a larger price move, so traders often watch a squeeze for a possible breakout.
- The Expansion: When the bands widen, it indicates that volatility is increasing. This can occur when price makes a stronger move or when a new trend starts to develop.
During a strong price move, the price may continue to stay near one of the outer bands. This behaviour is often called “Walking the Band”. For example, during a strong uptrend, the price may repeatedly move near the upper band. Therefore, touching or moving along the upper band does not automatically mean that the price is overbought or ready to fall.
Top Mistakes Traders Make with Bollinger Bands
- Do not treat every band touch as a reversal. Price can stay near the upper or lower band during a strong trend. Always wait for price action or candlestick confirmation.
- Don’t ignore the overall market trend. A band bounce may not work well against a strong trend. Check the broader market structure first.
- Do not enter too early during a squeeze. A squeeze shows low volatility, not the direction of the next move. Wait for a clear breakout and confirmation.
Advantages & Limitations
No single indicator is perfect. Bollinger Bands also have both advantages and limitations.
Advantages
- Bollinger Bands are adaptive. They adjust automatically to changes in market volatility.
- They are easy to understand. The bands make price movements and volatility easier to visualize.
- They are versatile. They can be used in both ranging and trending markets with a suitable strategy.
Disadvantages
- Bollinger Bands can lag. They are based on past price data, so signals may not reflect current price movements immediately.
- They can produce false breakouts. Price may move outside a band and quickly return inside.
- A squeeze does not predict direction. It shows low volatility but does not tell whether the next move will be upward or downward.
Bollinger Bands FAQs
Is touching the upper band always a sell signal?
No. In a strong uptrend, hitting the upper band signals massive upward momentum. Only consider selling if you see a bearish candlestick pattern or a divergence on the RSI.
What are the best settings for day trading?
The default (20, 2) works great. However, fast intraday traders often prefer tighter settings like a 10-to-14 period SMA with bands set at 1.5 standard deviations.
Can I use Bollinger Bands on any timeframe?
Yes. Bollinger Bands are fractal. They function the exact same way on a 5-minute chart for day trading as they do on weekly or monthly charts for investing.
Which indicator works best with Bollinger Bands?
The RSI (Relative Strength Index) and MACD work best. They help you confirm if a band touch is a real reversal or just a temporary pause in a strong trend.
What is a Bollinger Band “Walk”?
A walk happens during strong, extended trends when the price clings to and rides along the outer upper or lower band for multiple candles without pulling back.
Conclusion
Bollinger Bands are easily one of the best tools for tracking market volatility and price extremes. They clean up chart noise and show you exactly when a market is picking up speed or slowing down.
But remember, the key is never to use them alone. To build a solid trading system, always pair the bands with strict risk rules (like risking only 2% per trade) and momentum tools like the RSI or volume confirmation.
Disclaimer
This article is for educational purposes only and not financial advice. I am not a SEBI-registered advisor. Please consult your financial advisor before investing.
If you have any questions, feel free to contact us.
Thank you for visiting our StockTrades Blog.

Mrunmay is a Data Analytics enthusiast with a background in Software Engineering and Machine Learning. He has completed professional training in SQL, Python, Data Analysis and ML and has worked on multiple data-driven projects. With a strong interest in stock market analysis and technical trading strategies, he focuses on simplifying complex market concepts into practical and easy-to-understand guides for traders.
Note: The information shared is for educational purposes only and not financial advice.