Understanding stock charts is one of the most important skills for any trader or investor. If you know how to read stock charts properly, you can identify trends, spot opportunities and avoid unnecessary losses. In this guide, you will learn how to read stock charts step by step in a simple and practical way.
What Is a Stock Chart?
A stock chart is a graphical representation of a stock’s price movement over a specific period of time.
It helps traders and investors:
- Analyze price trends
- Identify buying and selling opportunities
- Understand market behavior
- Make informed decisions
Charts visually show how price moves — instead of just numbers.
Types of Stock Charts
There are three main types of charts used in the stock market:
1. Line Chart
A line chart connects closing prices with a simple line.
- Easy to understand
- Good for beginners
- Shows overall trend clearly
However, it does not show detailed price movement during the day.
2. Bar Chart
A bar chart shows:
- Opening price
- Closing price
- High
- Low
It provides more information than a line chart but may look complex for beginners.
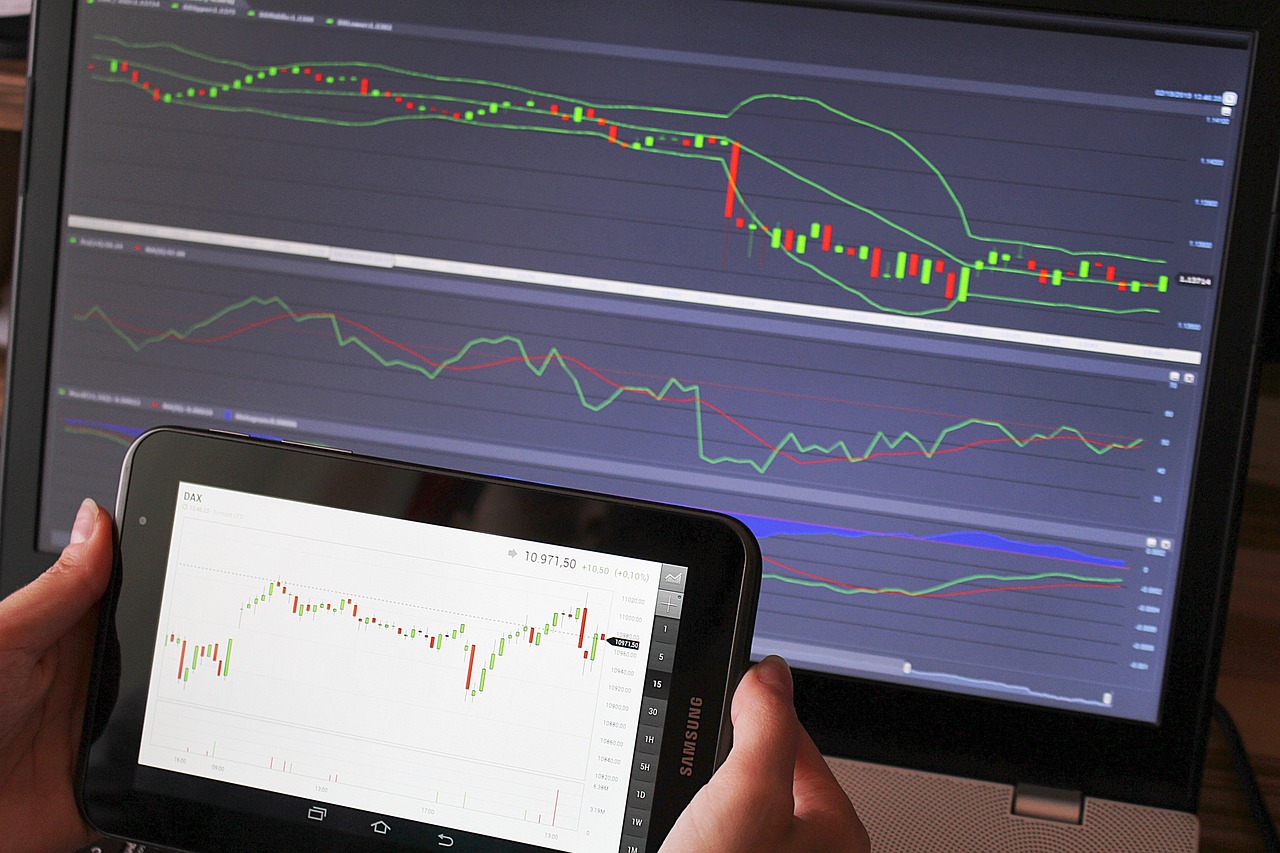
3. Candlestick Chart (Most Popular)
Candlestick charts are widely used in technical analysis.
Each candle shows:
- Open price
- Close price
- High
- Low
- Green candle → Price closed higher
- Red candle → Price closed lower
Candlestick charts give detailed market psychology and price action insights.
Important Elements of a Stock Chart
To read charts effectively, you must understand these key elements:
1. Price
Price is shown on the vertical (Y) axis.
It tells you at what level the stock is trading.
2. Timeframe
Time is shown on the horizontal (X) axis.
Common timeframes:
- 1 minute
- 5 minutes
- 1 hour
- Daily
- Weekly
Short-term traders use smaller timeframes. Investors use daily or weekly charts.
3. Volume
It shows how many shares were traded. Volume helps confirm price trends.
- High volume = strong movement
- Low volume = weak movement
How to Identify Trends
There are three types of trends:
1. Uptrend
- Higher highs and higher lows.
- Price is moving upward.
2. Downtrend
- Lower highs and lower lows.
- Price is moving downward.
3. Sideways Trend
- Price moves within a range.
Identifying trend is the first step before taking any trade.
Understanding Support and Resistance
- Support = A price level where buying pressure increases.
- Resistance = A price level where selling pressure increases.
These levels help traders:
- Decide entry point
- Set stop loss
- Plan target
Support and resistance are powerful tools in chart reading. If you want to master these levels properly, check out our detailed guide on https://stocktrades.blog/support-and-resistance-in-stock-market/
Why Learning Chart Reading Is Important
Reading charts helps you:
- Improve timing
- Reduce emotional decisions
- Identify market structure
- Trade with more confidence
Charts tell a story — you just need to learn how to read it. Start simple, practice regularly and always combine chart reading with proper risk management.
Frequently Ask Questions
Which chart is best for beginners?
Line charts are easiest to understand, but candlestick charts are most commonly used.
What timeframe is best for trading?
It depends on your strategy. Intraday traders use smaller timeframes, while investors prefer daily or weekly charts.
Is chart reading enough for trading?
No. Chart reading should be combined with risk management and proper strategy.
Conclusion
Learning how to read stock charts is an essential skill for every trader and investor. By understanding chart types, trends, volume and support and resistance levels, you can make smarter and more confident trading decisions.
Disclaimer
This article is for educational purposes only and not financial advice. Stock market investments are subject to market risks. Please conduct your own research before trading.
If you have any questions, feel free to contact us through our https://stocktrades.blog/contact-us-stocktrades/ page.
Also Thank you for visiting https://stocktrades.blog/ and being a part of our learning community.
Mrunmay is a Data Analytics enthusiast with a background in Software Engineering and Machine Learning. He has completed professional training in SQL, Python, Data Analysis and ML and has worked on multiple data-driven projects. With a strong interest in stock market analysis and technical trading strategies, he focuses on simplifying complex market concepts into practical and easy-to-understand guides for traders.
Note: The information shared is for educational purposes only and not financial advice.