Stock charts help traders understand market trends and potential price movements. By studying various price formations, trendlines and chart structures, traders can identify potential trend reversals or continuation signals within the market.
These patterns form the foundation of technical analysis and assist traders in making informed trading decisions based on historical price behaviour. Some chart patterns, such as trendlines, are relatively simple, while others are more advanced, encompassing formations such as Double Tops, Head and Shoulders, and Triangles.
Understanding stock charts can enhance market analysis and provide deeper insights into price action and overall market sentiment.
What Is Stock Charts?
A stock chart is a graphical representation of changes in a stock’s price over a specific period. It helps traders and investors analyse market trends, price movements and trading activity more effectively.
Stock charts display key market information, such as price changes, trading volume, and various technical indicators. By studying these charts, traders can identify market trends and make better buying and selling decisions.
Most stock charts use the vertical axis to represent price and the horizontal axis to represent time. These charts are also available in various timeframes, such as daily, weekly, and monthly.
Types of Stock Charts
There are three main types of charts used in the stock market:
1. Line Chart
The line chart is one of the simplest stock charts used in technical analysis. It connects the closing prices of a stock over a specific period using a continuous line. Traders primarily use line charts to easily identify the overall market trend and the long-term direction of prices.
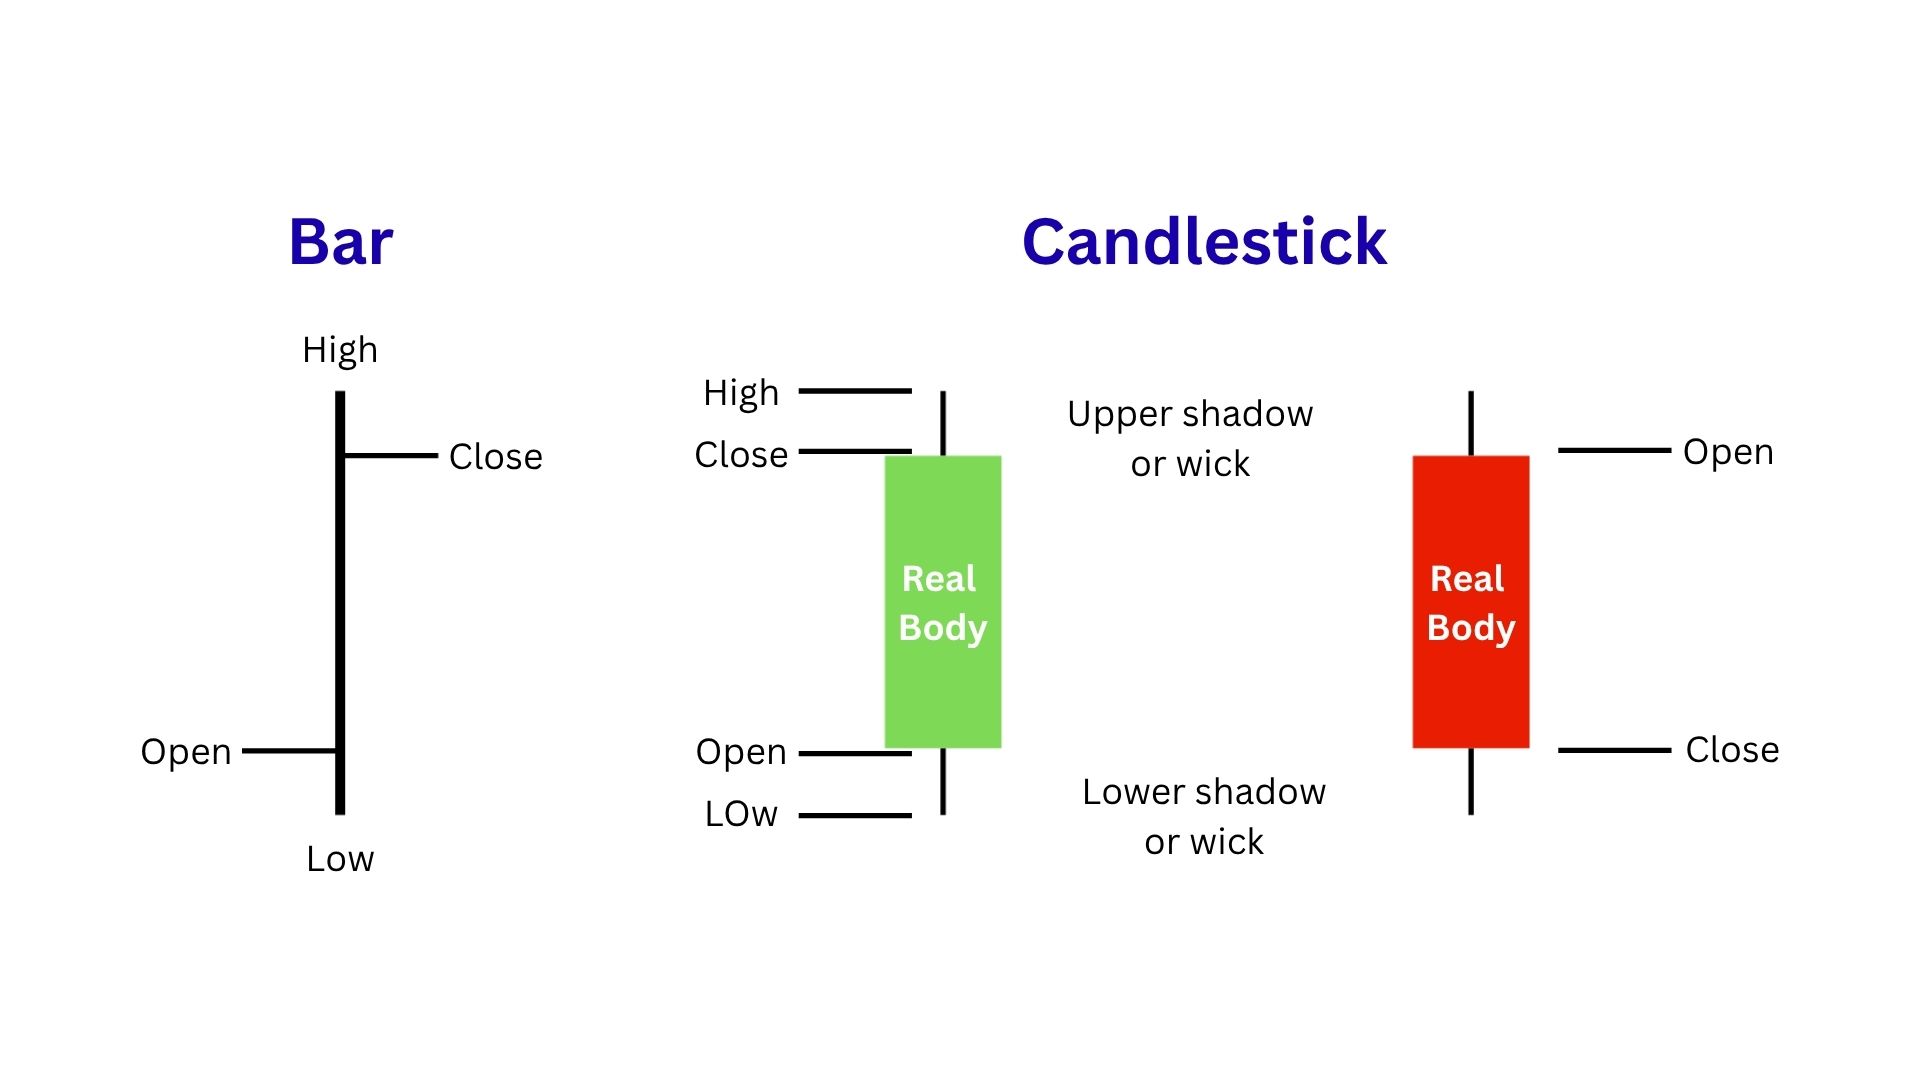
2. Bar Chart
Compared to the line chart, the bar chart provides more detailed price information. Each bar represents the opening, closing, high and low prices for a specific period. This helps traders analyse market volatility and understand price movements more clearly.
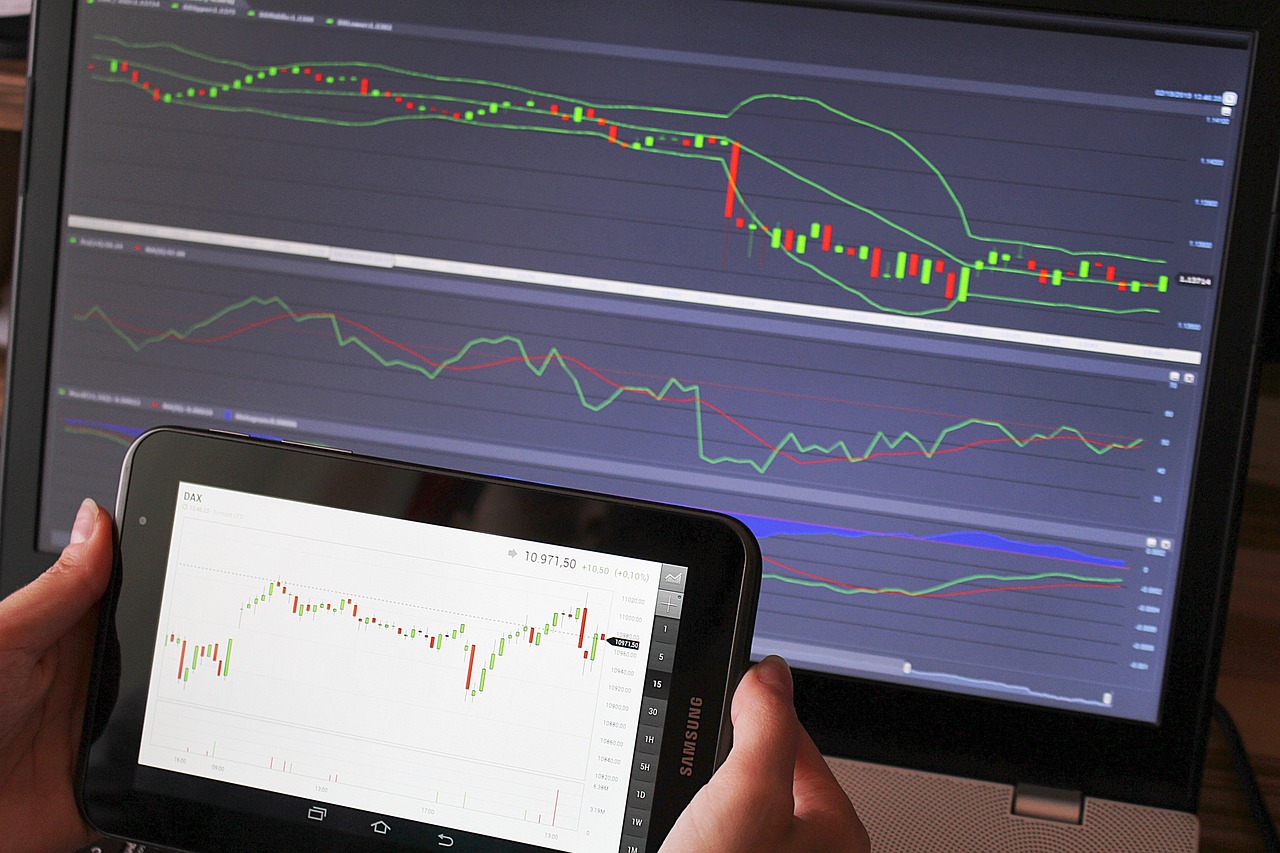
3. Candlestick Chart
The candlestick chart is one of the most widely used stock charts in trading. It displays price data similar to the bar chart, but in a more visual and easy-to-understand format. Each candlestick indicates the opening, closing, high, and low prices, as well as the bullish or bearish sentiment prevailing in the market. Traders often use candlestick charts to identify price patterns, trends and potential entry or exit points.
Why Are Stock Charts Important?
Stock charts play a important role for both investors and traders, as they help them understand a stock’s historical price fluctuations and trading activity. They provide a clear picture of how a stock behaves under various market conditions, making market analysis easier and more effective.
Long-term investors often use stock charts to identify broad market trends and to spot opportune moments to invest in fundamentally strong companies. To guide their investment decisions, they typically look for trends of steady growth and temporary dips in price.
On the other hand, short-term traders rely on stock charts to identify quick buying and selling opportunities. They utilize shorter timeframes, price action, chart patterns and technical indicators to capture short-term market movements.
Stock charts also assist market participants in the following ways:
- Visually tracking historical price movements
- Identifying bullish, bearish, or sideways markets
- Pinpointing optimal entry and exit points for buying and selling
- Understanding market sentiment through price and volume movements
- Making decisions based on market data rather than emotions or rumours
By learning how to read stock charts, traders and investors can gain a better understanding of market behaviour and enhance their overall decision-making process.
Frequently Ask Questions on Stock Charts
Which chart is best for beginners?
Line charts are easiest to understand, but candlestick charts are most commonly used.
What timeframe is best for trading?
It depends on your strategy. Intraday traders use smaller timeframes, while investors prefer daily or weekly charts.
Is chart reading enough for trading?
No. Chart reading should be combined with risk management and proper strategy.
Conclusion
Understanding stock charts is extremely beneficial. By learning how to read various types of charts, identify market trends, and analyse price action, traders can make more informed and prudent decisions regarding the market.
While mastering stock charts requires time and practice, consistent study undoubtedly enhances one’s chart-reading skills and market comprehension. Whether you are a long-term investor or a short-term trader, stock charts can help you analyze the market with greater confidence and clarity.
Disclaimer
This article is for educational purposes only and not financial advice. I am not a SEBI-registered advisor. Please consult your financial advisor before investing.
If you have any questions, feel free to contact us.
Thank you for visiting our StockTrades Blog.
Mrunmay is a Data Analytics enthusiast with a background in Software Engineering and Machine Learning. He has completed professional training in SQL, Python, Data Analysis and ML and has worked on multiple data-driven projects. With a strong interest in stock market analysis and technical trading strategies, he focuses on simplifying complex market concepts into practical and easy-to-understand guides for traders.
Note: The information shared is for educational purposes only and not financial advice.