
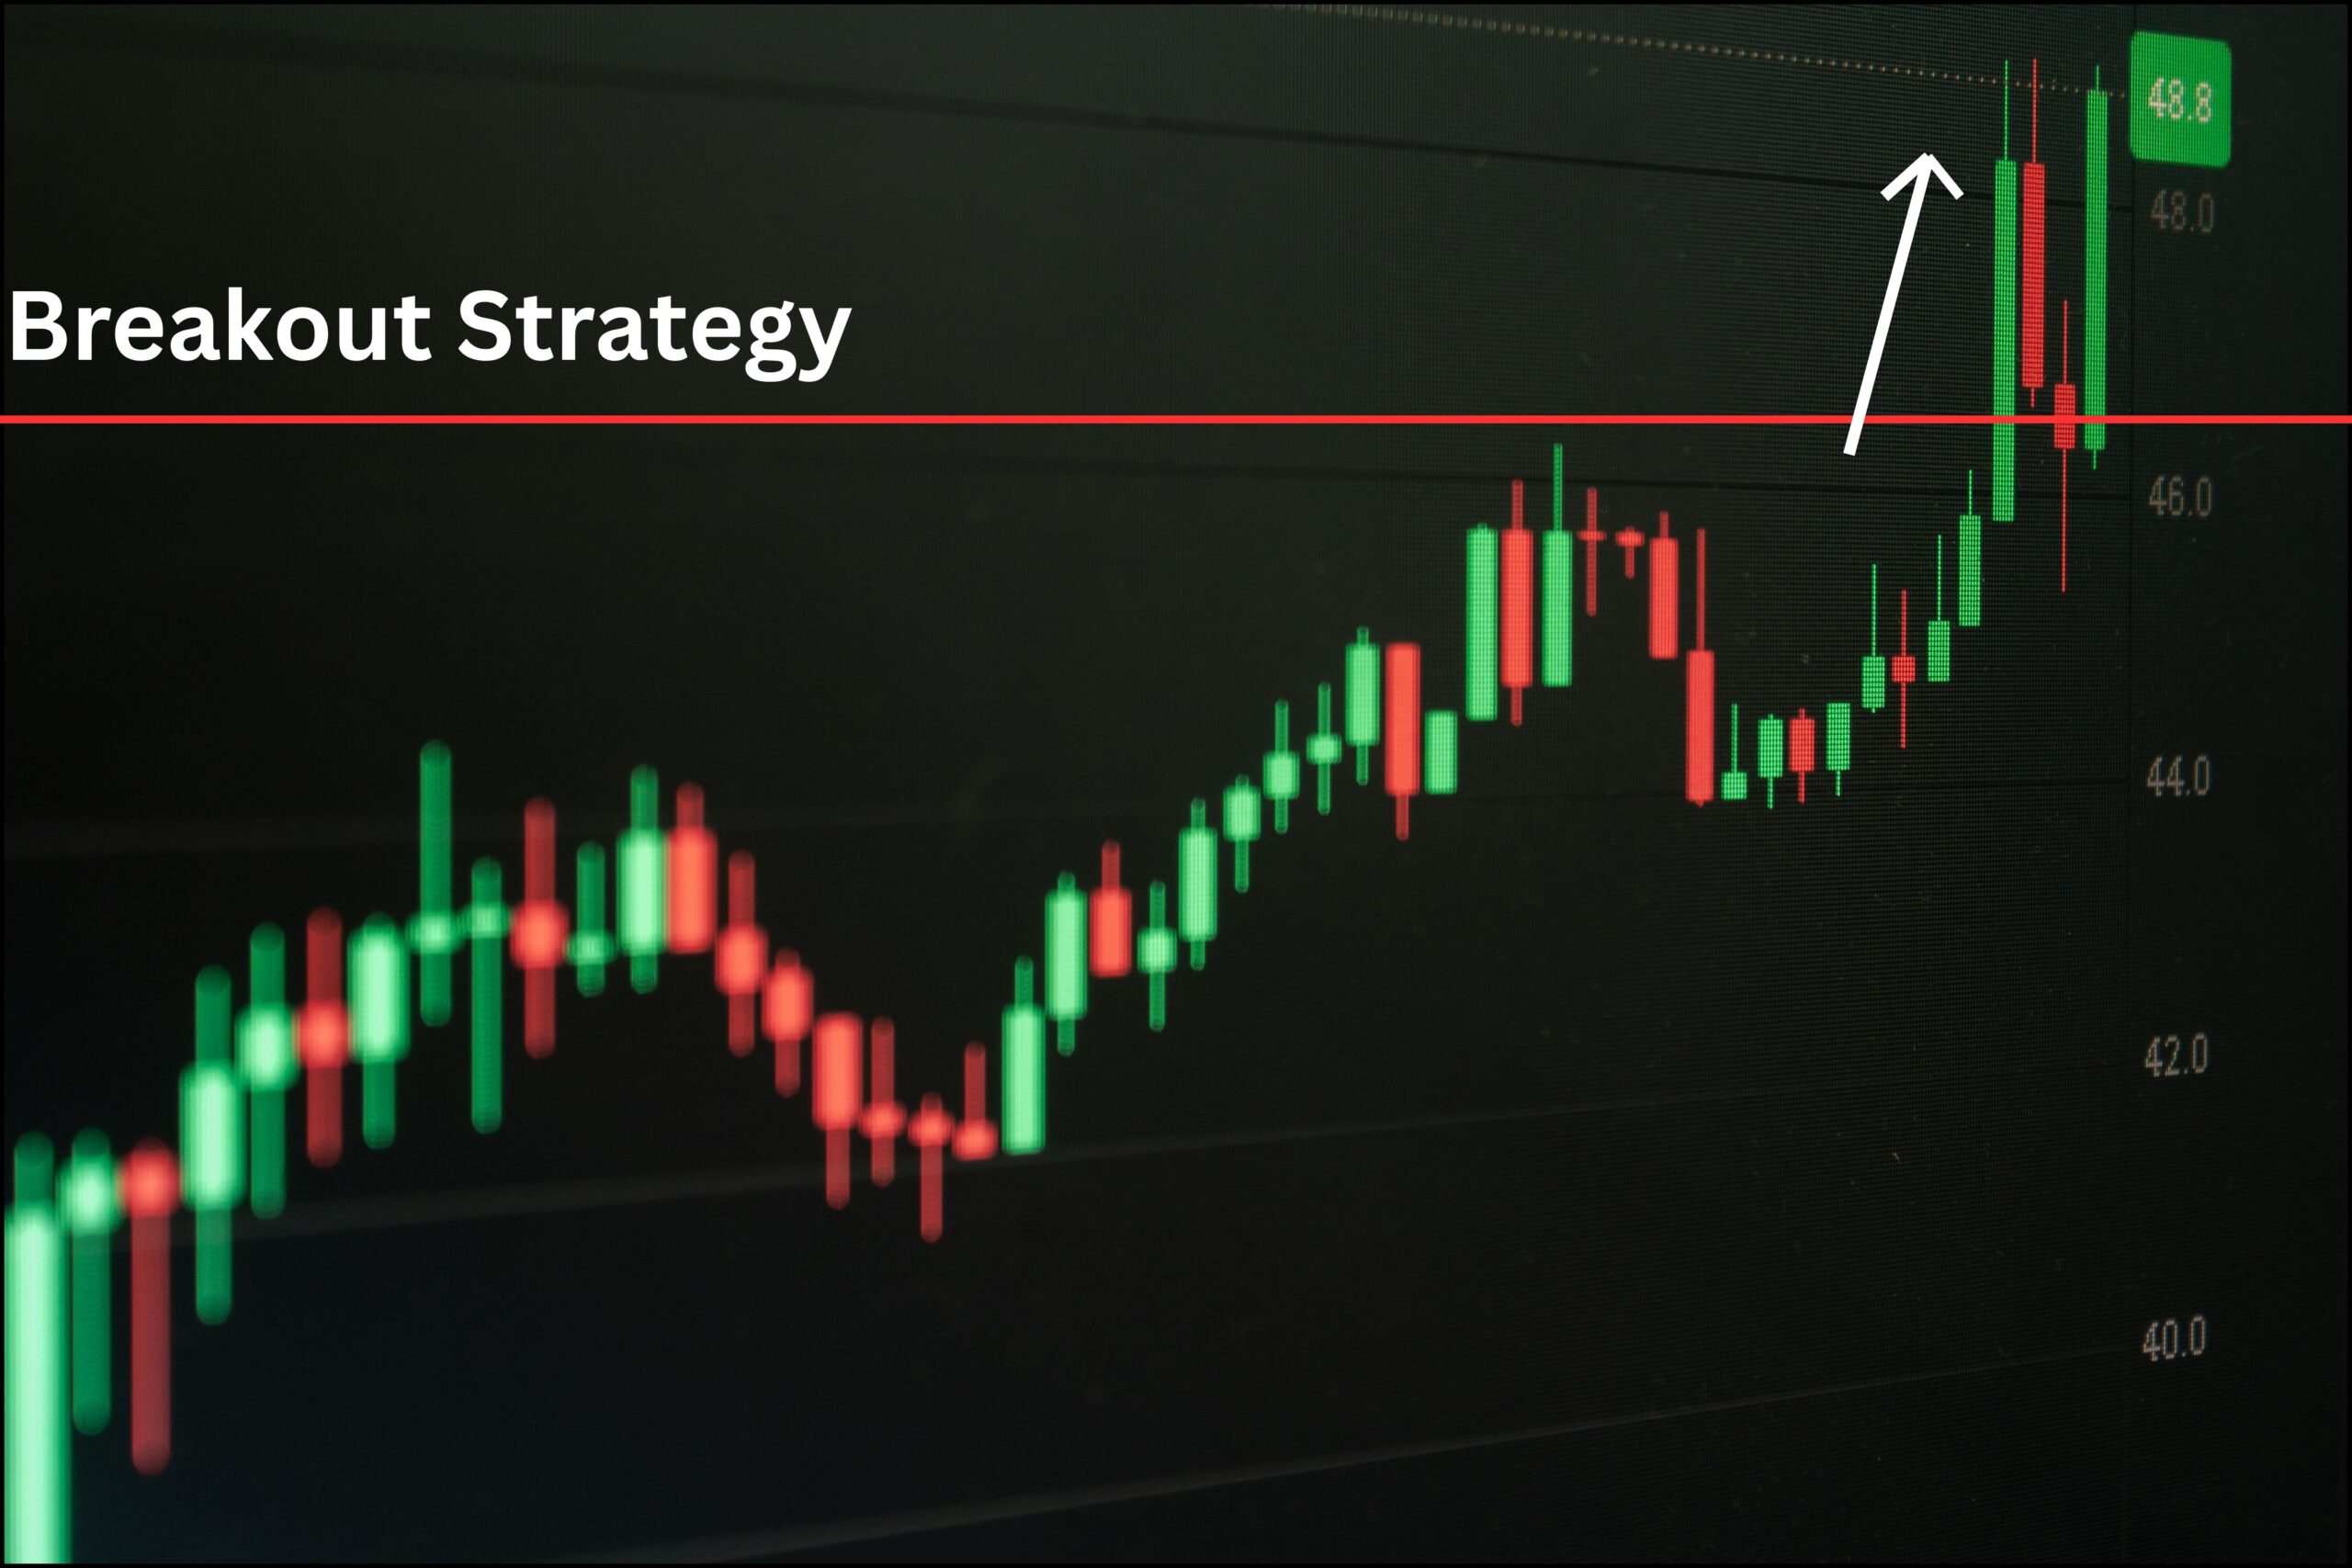
Various strategies and indicators are used to take advantage of price movements in the market. One such approach is the breakout strategy, when an asset moves past key support or resistance levels, helping traders profit from significant price changes. Now let’s look at what’s involved in a breakout strategy and how traders use it to execute trades.
What is Breakout in Trading?
A breakout occurs when a stock’s price rapidly moves past a key support or resistance level. This movement often indicates that the stock is breaking out of its previous trading range and may be starting a new trend.
Breakouts are often accompanied by high trading volume and increased market movement, which can indicate greater interest in buying or selling. When the price moves above a resistance level, it can indicate a potential uptrend. Conversely, a break below a support level can signal a potential downturn.
Traders closely monitor breakout patterns because they often lead to increased volatility and significant price movements, creating potential trading opportunities across various market conditions and timeframes.
Types of Breakout in Trading
Horizontal Breakout
A horizontal breakout happens when the stock price moves above a key resistance level or drops below a strong support level after trading in a tight range for some time. This move usually shows that the consolidation period is over and a fresh price movement is starting.
Trendline Breakout
A trendline breakout occurs when the price breaks out of an established trendline. This tells traders that the current trend is getting weak, and the market might either reverse its direction or start a completely new trend.
Triangle Breakout
A triangle breakout happens when the stock price breaks out of a triangle chart pattern; such as an ascending, descending, or symmetrical triangle. This big move usually signals that the previous trend is continuing or a new trend is beginning.
Flag and Pennant Breakout
This breakout occurs when the price breaks out of a flag or pennant pattern after a short period of consolidation. It is a strong sign that the previous market trend is ready to continue in the same direction.
Head and Shoulders Breakout
A head and shoulders breakout happens when the price breaks through the “neckline” of a Head and Shoulders or an Inverse Head and Shoulders pattern. Traders widely consider this breakout as a clear signal of a trend reversal.
How Breakout Trading Works
Breakout trading is all about catching the exact moment when a stock price moves beyond a key support or resistance level. This big move usually tells traders that the market is getting stronger and a fresh trend is starting.
To find a potential breakout, traders look for chart patterns or “consolidation zones” where the stock price moves within a tight, narrow range. When the price finally breaks above resistance or drops below support, it signals the start of a breakout.
Traders also watch the recent swing highs and swing lows because these levels act as major barriers for the price. Along with these levels, trading volume plays a very important role. A breakout supported by high volume is always considered more reliable because it shows that big institutional buyers and sellers are participating in the move.
Finally, experienced traders always wait for confirmation before entering a trade. Breakouts with very low volume often fail, causing the price to quickly drop back inside its old trading range
How Breakouts Behave in Different Financial Markets
While the basic psychology of a breakout stays the same- buyers or sellers overpower a key price level- the reasons behind it change depending on the asset class you trade. To trade breakouts successfully, you must understand what triggers them in different markets.
The Stock Market: Corporate Events Drive Breakouts
In stocks, a breakout rarely happens without a reason. Institutional investors (like FIIs or DIIs) usually react to specific events and cause the breakout. When a stock breaks out of a long consolidation phase, these big players push the price higher.
Common triggers: Companies report strong quarterly earnings that beat expectations, regulators approve positive news, or a whole sector rallies (like IT or auto stocks in the Nifty index).
What to watch: Always check delivery volume to confirm breakouts. If a stock breaks resistance on low volume, it often signals a false move. Look for breakouts with high volume that show major players buying heavily.
The Forex Market: Global Economics Fuel Breakouts
The Forex market stays open 24 hours a day, 5 days a week, and offers high liquidity. Global economic news constantly tests support and resistance levels. These breakouts often show extreme volatility and rapid price moves.
Common triggers: Central banks announce interest rate changes (such as the US Fed or RBI), release inflation data (CPI), or geopolitical events suddenly unfold.
What to watch: Track the economic calendar closely. Currency pairs like USD/INR or EUR/USD may trade in tight ranges for days but then break out violently right after news releases. Beginners should avoid trading at the exact time of news and wait for the price to retest.
The Commodity Market: Supply, Demand, and Geopolitics Drive Breakouts
Commodities like Gold, Silver, and Crude Oil behave differently because they represent physical goods. Breakouts here often reflect structural changes and can start long multi-month trends.
Common triggers: Geopolitical tensions or wars push Gold up as a safe haven. OPEC production cuts affect Crude Oil prices. Extreme weather harms crops. Global supply chain disruptions also impact prices.
What to watch: Commodity breakouts tend to follow cycles and seasons. Focus on daily or weekly charts when trading breakouts in Crude Oil or Gold. These larger breakouts offer some of the best trend-following opportunities for patient traders.
Example of a Breakout Trade
For example, suppose Wipro’s stock has been trading between ₹250 and ₹260 for several weeks. During this time, ₹260 acts as a strong resistance level, and the stock struggles to move above this price.
As a trader, you watch the price action closely and wait for confirmation. One day, Wipro’s stock breaks above ₹260 with a high trading volume. You enter a buy trade just above ₹260 and place a stop-loss slightly below the breakout level to manage risk.
As the stock price continues to rise, you book profits at different levels and gradually move your stop-loss upward to protect your gains. This approach helps you control risk while benefiting from the breakout momentum.
Advantages of a Breakout Strategy
- Breakout trading gives you the chance to catch strong price movements and earn higher profits.
- You get clear entry and exit levels based on support and resistance zones.
- This strategy allows you to enter trades early when a new trend begins.
- You can use breakout trading in stocks, forex, commodities, and other financial markets.
- Breakout setups work across different timeframes like intraday, swing, and positional trading.
- It performs well when the market is fast-moving and volatile.
- You can combine breakout signals with technical indicators for better trade confirmation.
Disadvantages of a Breakout Strategy
- False breakouts can trigger trades that quickly move in the opposite direction.
- You need to watch the market closely and make timely decisions.
- Low trading volume can reduce the reliability of breakout signals.
- Breakout strategies often perform poorly in sideways or range-bound markets.
- Sudden price fluctuations can hit stop-loss levels, causing unnecessary losses.
Frequently Asked Questions
1. What is a Breakout in Trading?
In trading, a breakout occurs when the price moves above a resistance level or below a support level with strong momentum. This typically signals the beginning of a new trend and a potential trading opportunity.
2. What is a Breakout Strategy?
In a breakout strategy, a trade is entered in a specific direction, with the expectation of a strong subsequent move, when the price breaks through a key level, such as support or resistance.
3. How to Identify a Breakout Pattern?
You can identify a breakout pattern when the price consolidates within a specific range (such as a triangle, rectangle or flag) and subsequently breaks out with strong momentum and volume.
4. Is Breakout in Trading Suitable for Beginners?
Yes, breakout trading is relatively simple for beginners because it provides clear entry and exit points. However, beginners should always practice proper risk management.
5.What is a False Breakout in Trading?
A false breakout in trading occurs when the price breaks through a specific level but immediately reverts back into its original range. This often traps traders who entered the market prematurely.
Conclusion
‘Breakout in trading’ is a highly effective strategy that, when executed correctly, can yield significant profits. By understanding breakout patterns, their significance and how to trade them effectively, traders can enhance their chances of success. Avoiding common mistakes and adhering to best practices will further improve trading outcomes.
Disclaimer
This article is for educational purposes only and not financial advice. I am not a SEBI-registered advisor. Please consult your financial advisor before investing.
If you have any questions, feel free to contact us.
Thank you for visiting our StockTrades Blog.

Mrunmay is a Data Analytics enthusiast with a background in Software Engineering and Machine Learning. He has completed professional training in SQL, Python, Data Analysis and ML and has worked on multiple data-driven projects. With a strong interest in stock market analysis and technical trading strategies, he focuses on simplifying complex market concepts into practical and easy-to-understand guides for traders.
Note: The information shared is for educational purposes only and not financial advice.